Random spatial graphs
Graphs appear in many real-world situations. In many cases, the nodes also possess some spatial information which influences the configuration of the graph. For example, the nodes might represent the cities that a travelling salesman must visit, in which case the distances between cities will be crucial information for constructing an efficient itinerary.
In general, consider graphs constructed on random points in (some subset of) Euclidean space. Given the set of points, the edges in the graph are added according to some geometrical rule. For example, the Nearest-neighbour graph (NNG for short) has an edge from each node to the nearest other node, the minimal spanning tree is a tree whose vertex set is the given set of nodes with minimal total edge length, and the travelling salesman tour is the shortest path that starts and ends at the same node, and visits every other node exactly once.
These graphs, and their relatives, have applications in the modelling of various networks with spatial content, such as communications, social, or transportation networks.
Random variables such as the total edge length of the graph are interesting. In the NNG, for example, each point contributes an asymptotically negligible amount to the total (through its daughter edge), and distant points barely influence one another, so the total length satisfies a central limit theorem with an appropriate scaling. The same is true for the minimal spanning tree, which is a famous result of Kesten & Lee [MR1398055]. The central limit theorem for the travelling salesman tour is a long-standing open problem.
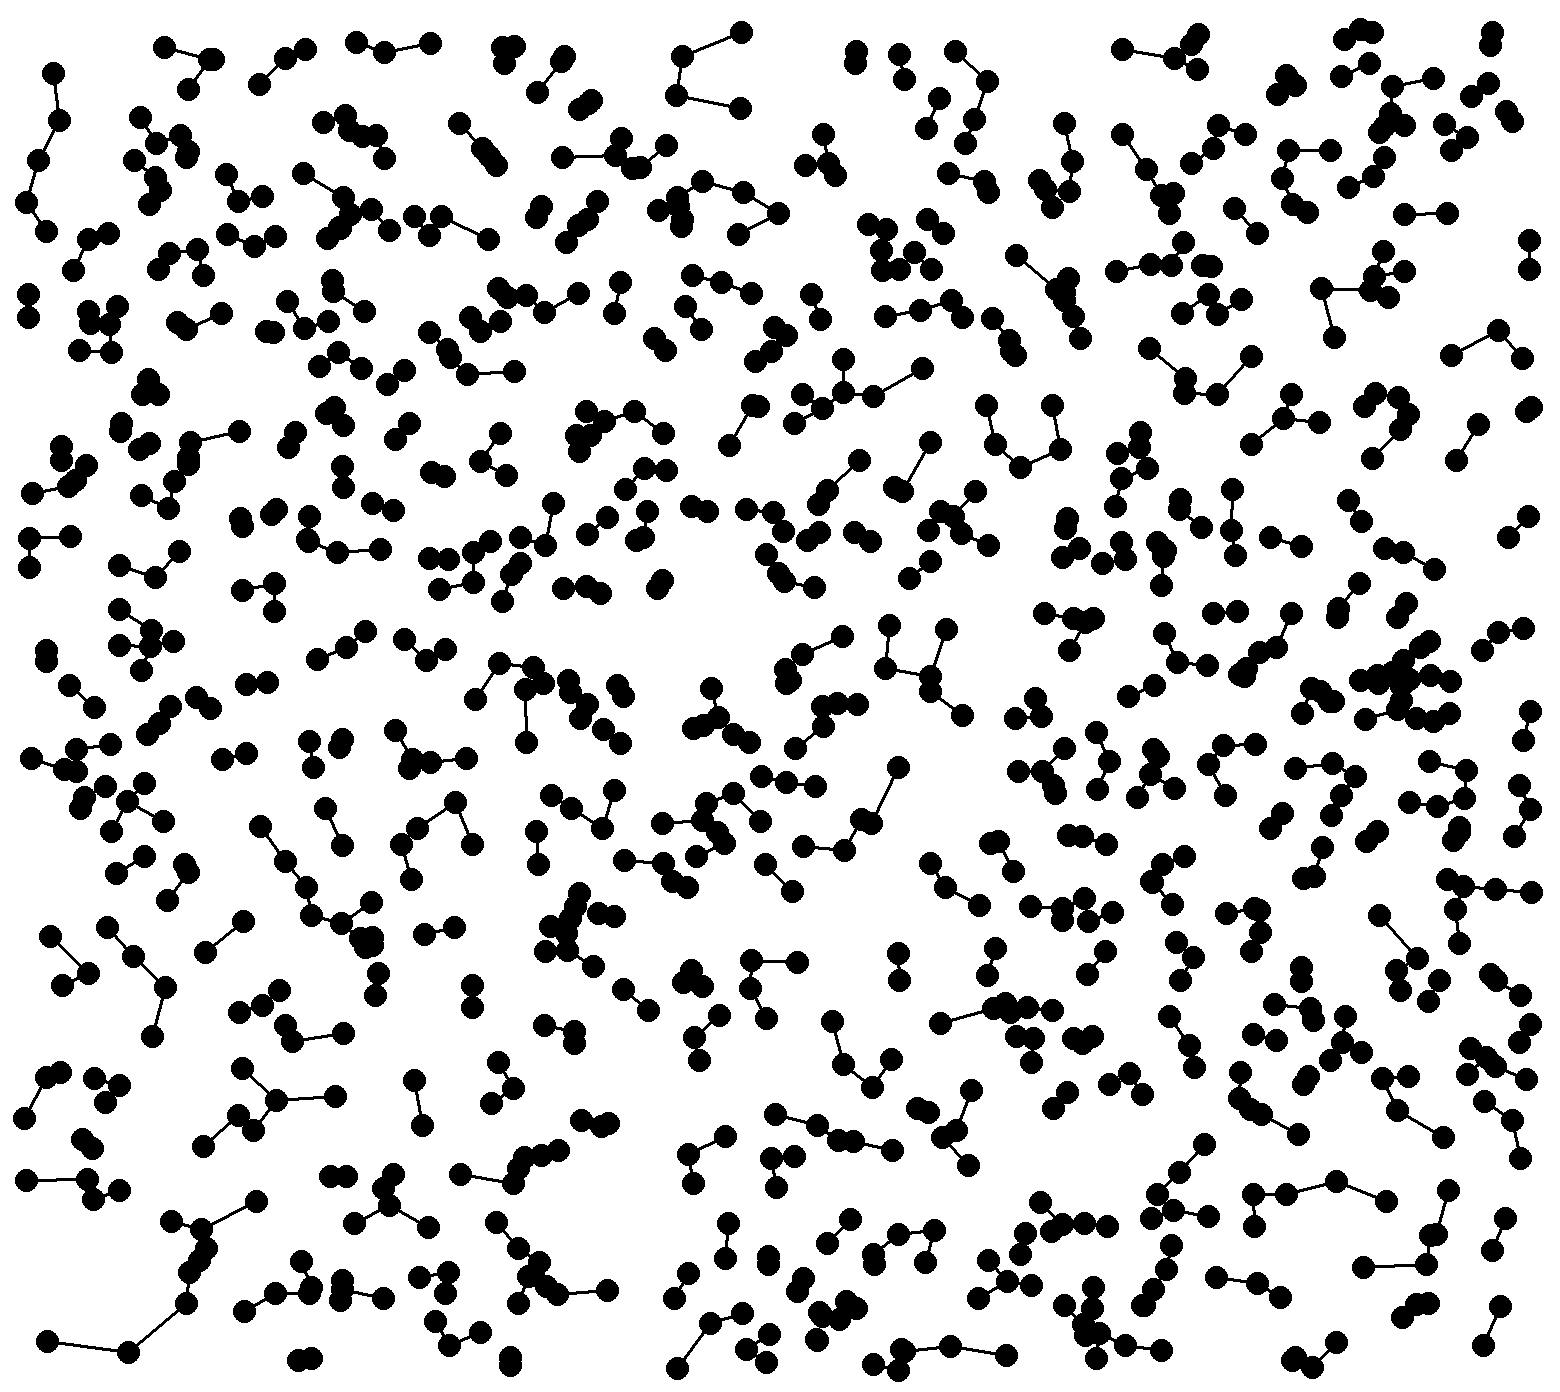
Nearest-neighbour graph
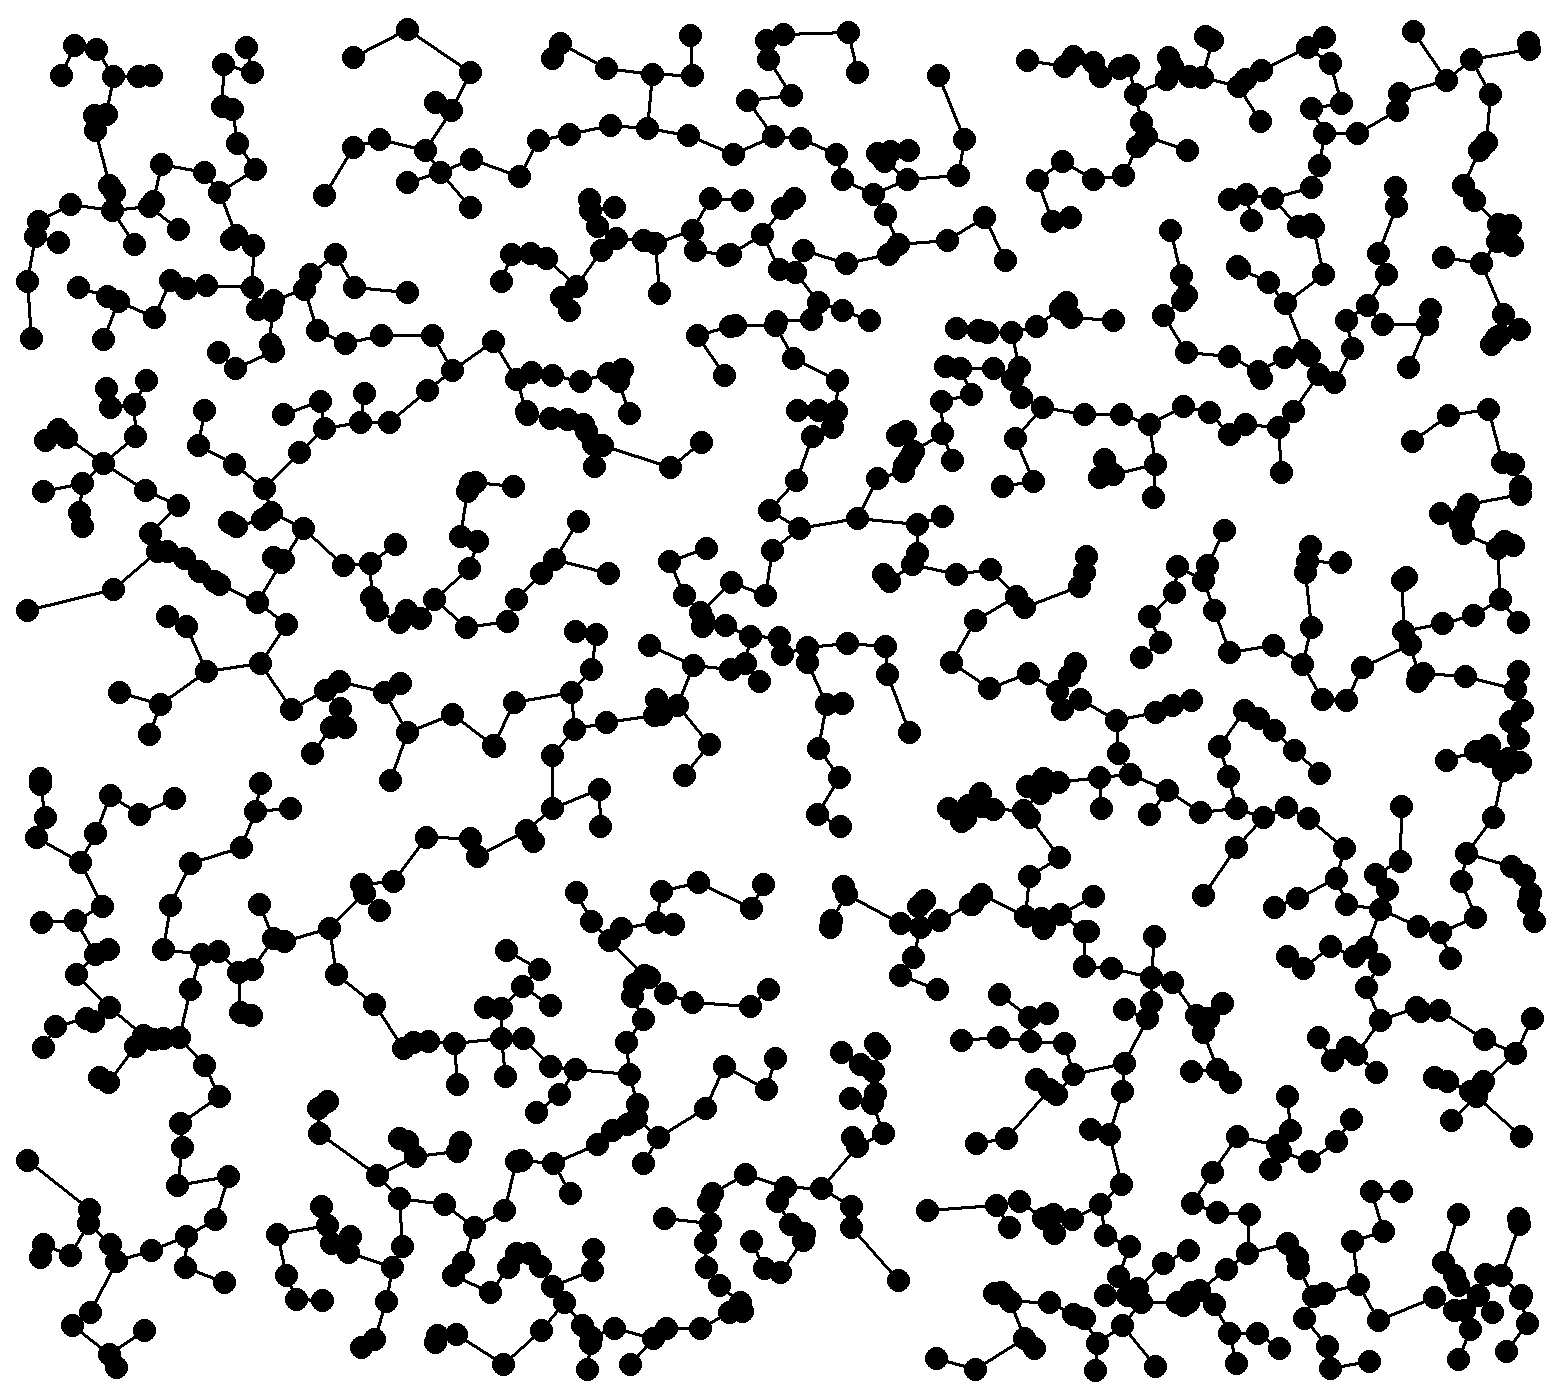
Minimal spanning tree
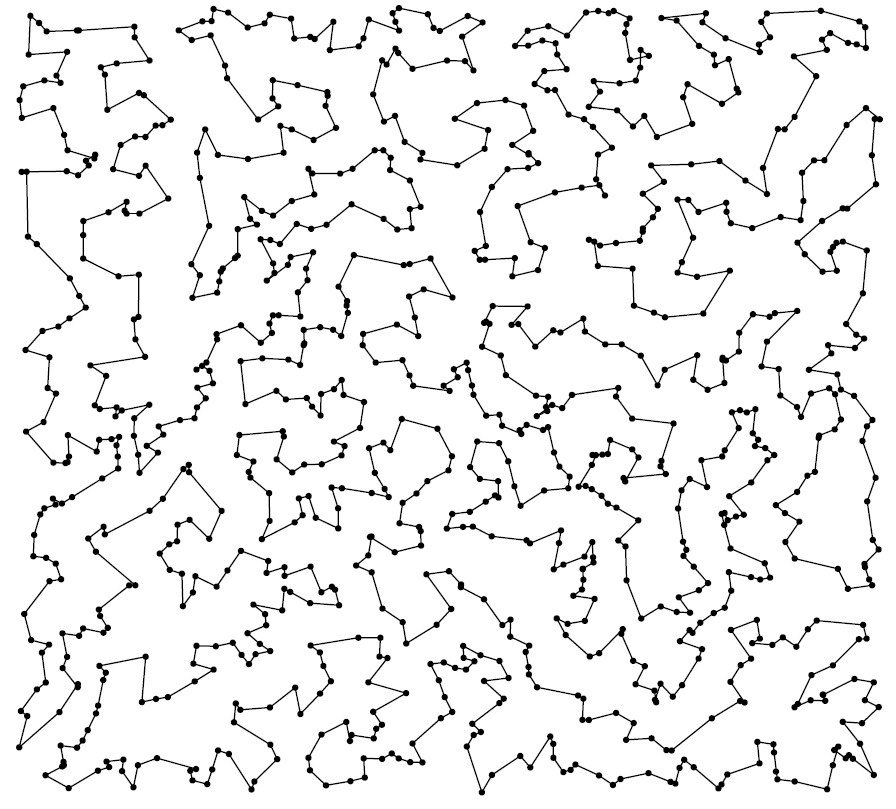
Travelling salesman tour
The minimal directed spanning tree
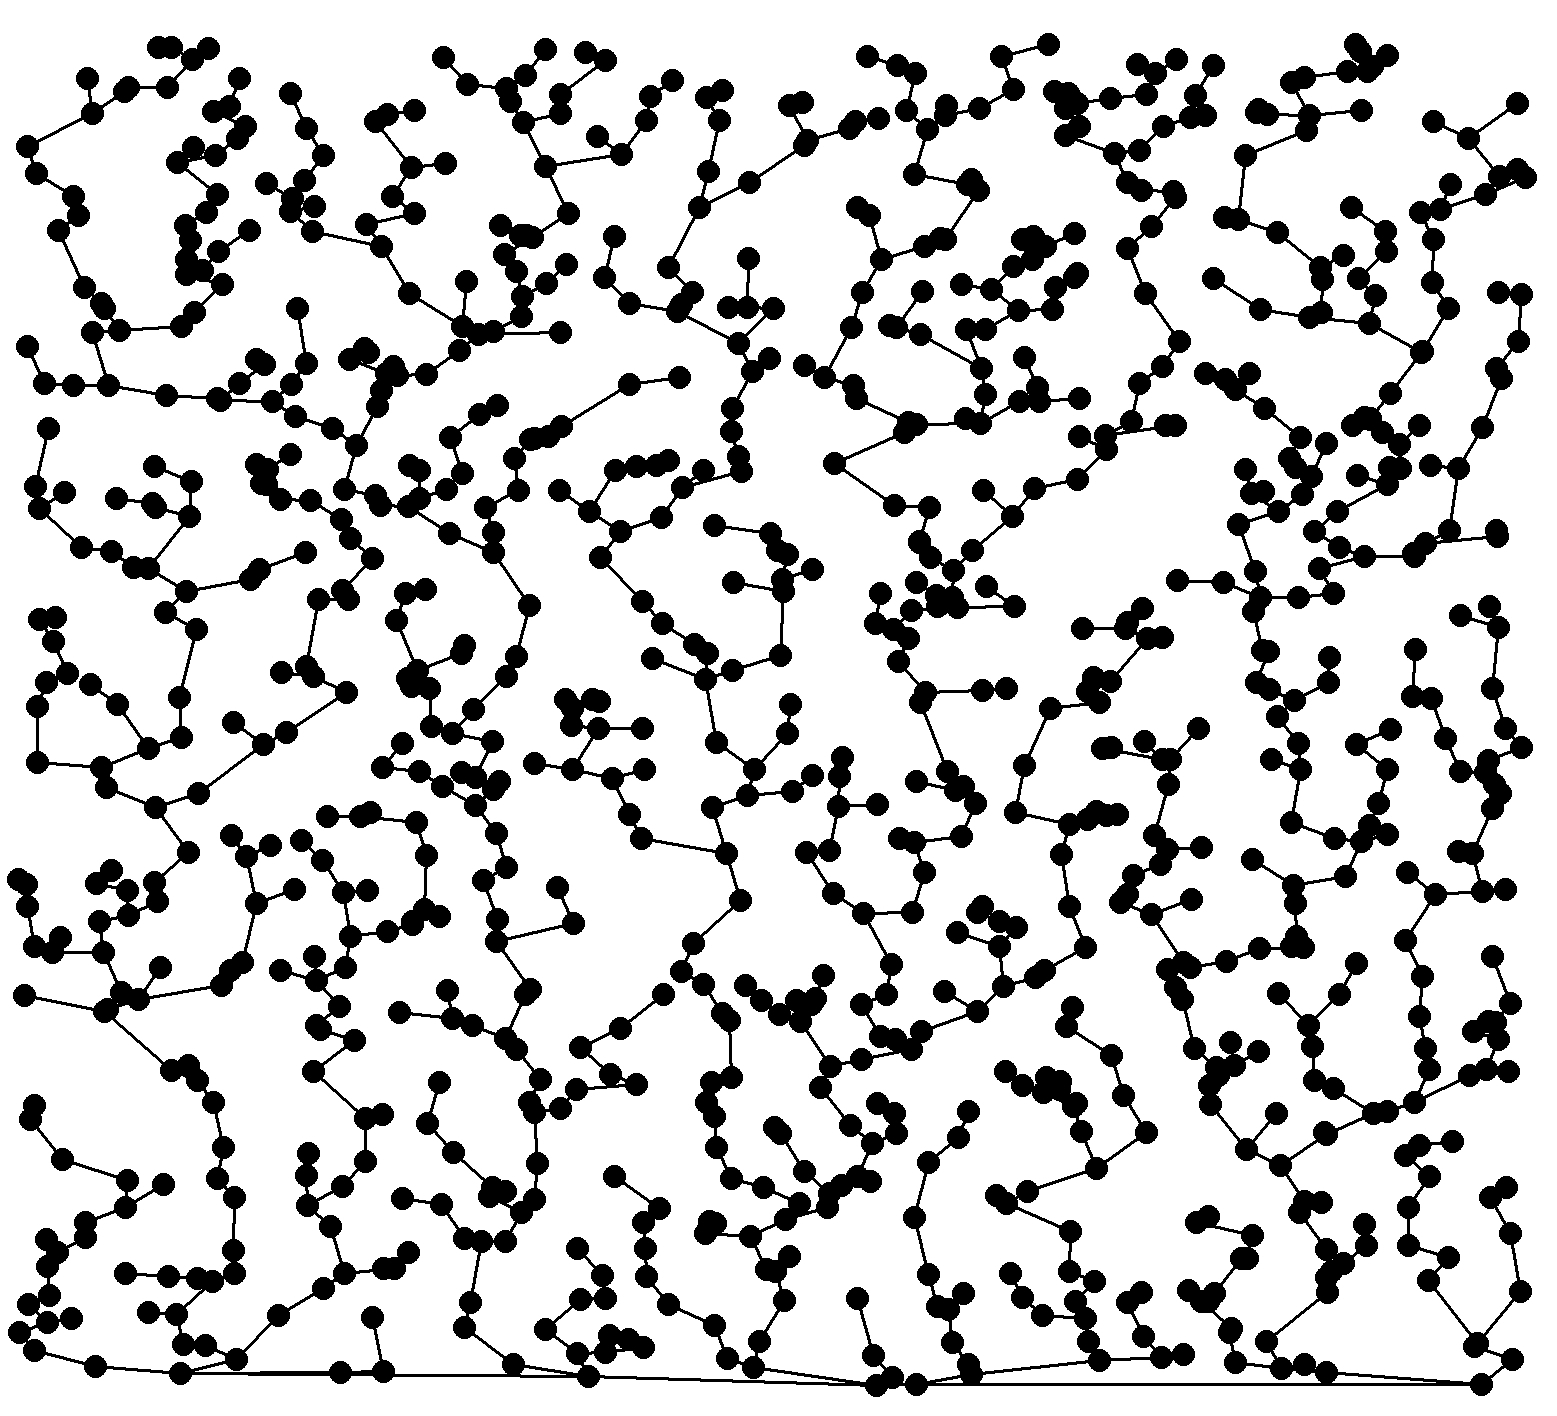
The minimal directed spanning tree (MDST) is a variation on the nearest-neighbour graph in which only a restricted set of relative directions is available for connections. The name is due to Bhatt & Roy [MR2035772], who considered the model in which only connections in the relative "south-west" quadrant are allowed. The name was chosen because an equivalent formulation is as a global optimization problem, like the ordinary minimal spanning tree, but with the directional constraint. More generally, the directional constraint can be expressed in terms of a partial order. Nearest-neighbour graphs with directional constraints had been earlier considered by Smith [link], and a closely related model (to the case of a "south" partial order) is that of Manna et al. [link]. Motivation is as a model for drainage and communications networks where there is a directional component.
With Mathew Penrose, we looked at various aspects of these graphs. In Bhatt & Roy's "south-west" model, each node is joined by an edge to its nearest neighbour in the south-west quadrant. If one adds a "root" at the bottom-left corner of the square (see the picture below), then the edges joined to the root asymptotically have a Dickman distribution. Furthermore, one can see from the picture that there can be very long edges near the boundary. These long edges can disrupt the usual central limit theorem behaviour for the total edge length. In the "south" version, each point is joined by an edge to the nearest point at a lower vertical coordinate. Again, for the limit distribution of the total edge length, boundary effects lead to a competition between a Gaussian component, arising from the bulk, and a non-Gaussian component, from near to the boundary. These boundary contributions can be described in terms of the on-line nearest-neighbour graph (see below). The relative weights of these two components varies with dimension.
Click on the buttons below for some of my work related to these graphs.
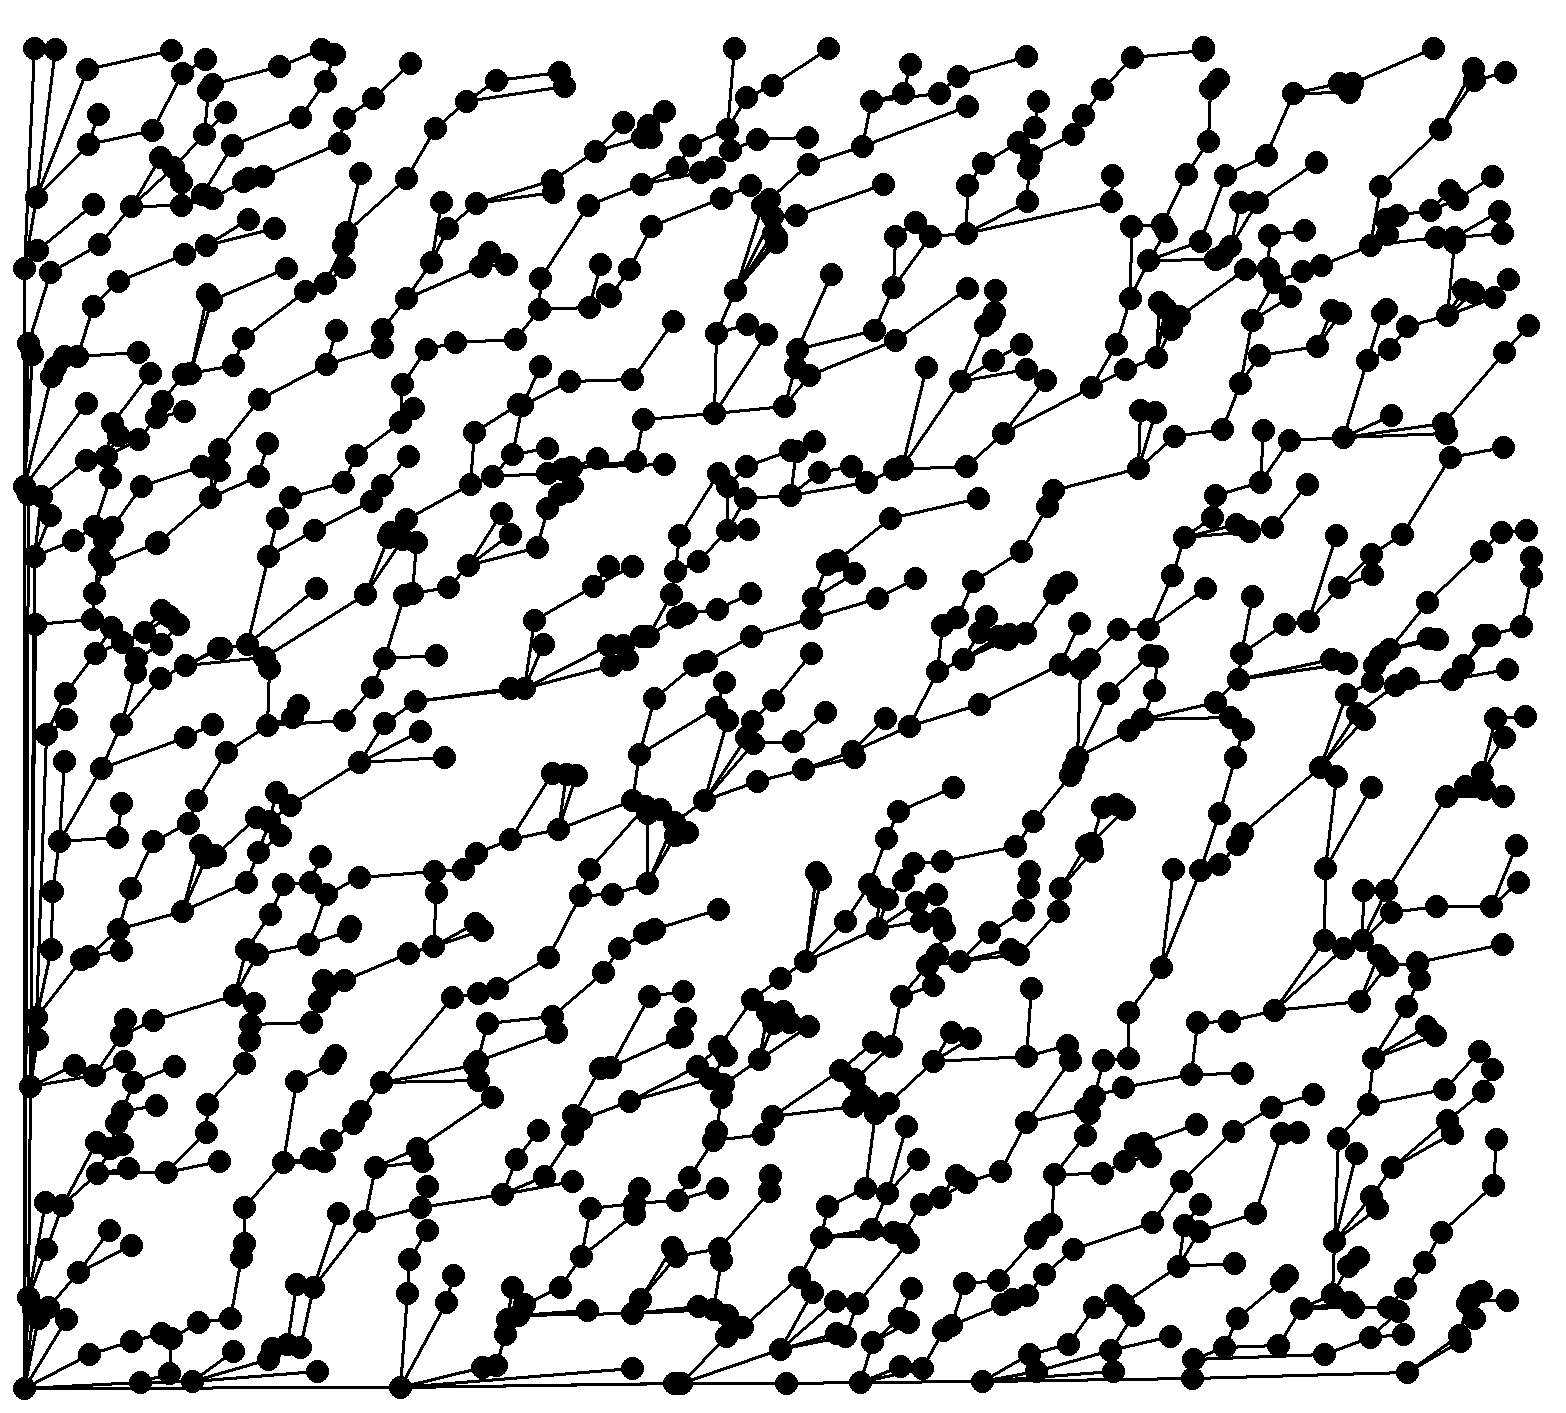
MDST with the "south-west" partial order
MDST with the "south" partial order
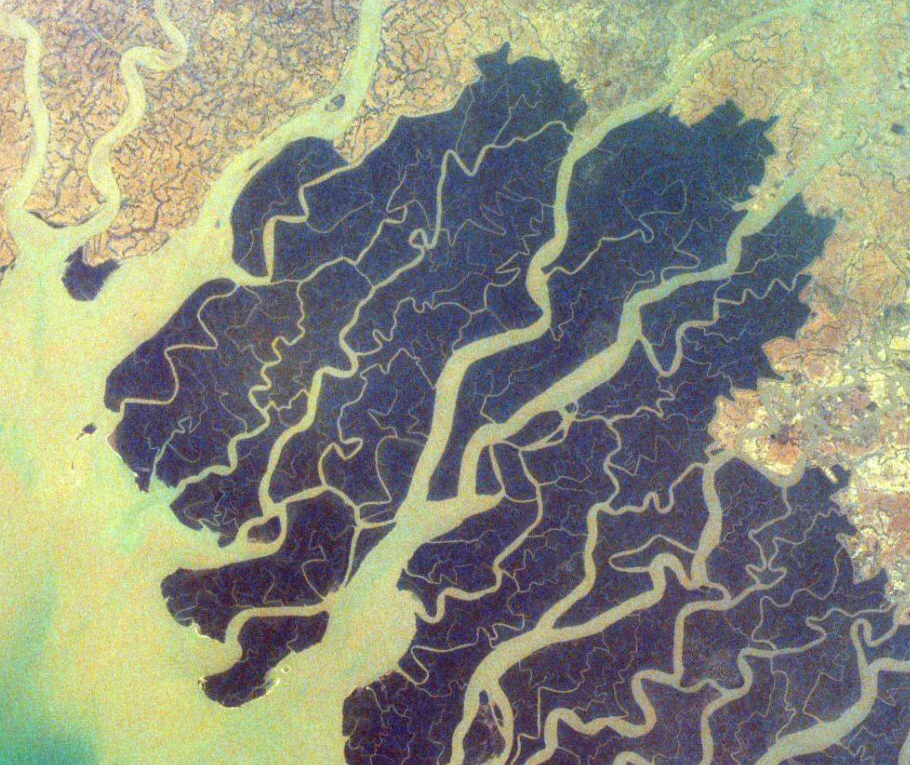
Ganges delta
Image NASA/JPL/UCSD/JSC
Geometric preferential attachment and the on-line nearest-neighbour graph
Preferential attachment models form a large and popular class of models of growing networks (with no spatial content) in which nodes are added in sequence, and each new node is joined to an existing node according to some rule which favours nodes whose number of connections is already high. Geometric preferential attachment (GPA) models balance preference according to degree with preference according to spatial proximity.
The first picture below is a GPA model in which the degree effect is dominant, so that spatial location plays little role and the graph has little apparent spatial structure. In the second picture, the proximity effect is more pronounced, and spatial structure is evident. This phase transition is reflected in the degree distribution of the graph, as we showed in work with Jonathan Jordan. The limit in which proximity completely dominates is the on-line nearest-neighbour graph (final picture). GPA models of this type were considered by Manna & Sen [link].
In the on-line nearest-neighbour graph, points arrive sequentially. On the arrival of each point after the first, that point is joined to its nearest-neighbour amongst those points already present. The ONG is a special case of a model studied by Berger, Bollobás, Borgs, Chayes, and Riordan [MR2080740; MR2329202], as well as a limit of the models of Manna & Sen described above. The name is due to Penrose.
The ONG is simple to formulate, but its total length has interesting behaviour: early on the in sequence, edges tend to be very long. These long, early edges can potentially disrupt the central limit theorem behaviour present in the ordinary nearest-neighbour graph, in a similar way to the boundary effects in the MDST.
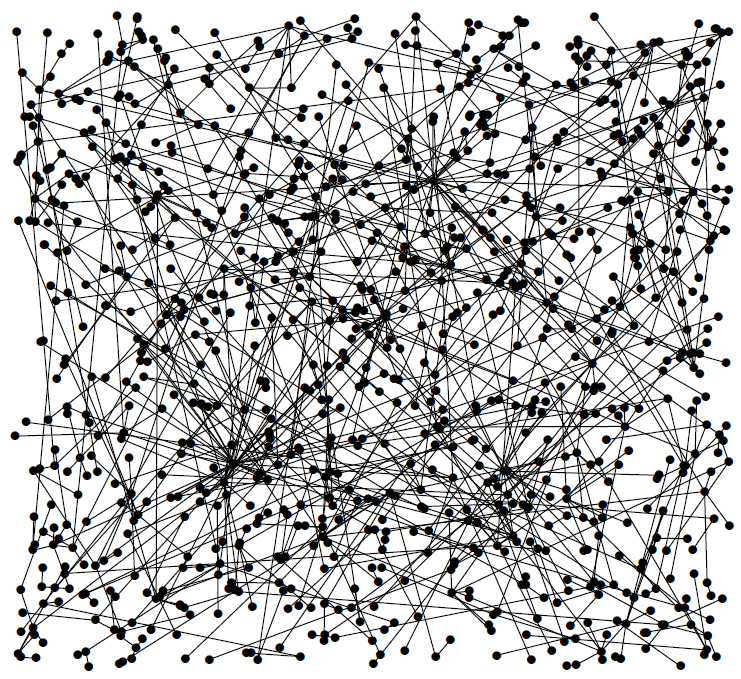
GPA graph with weak geometry
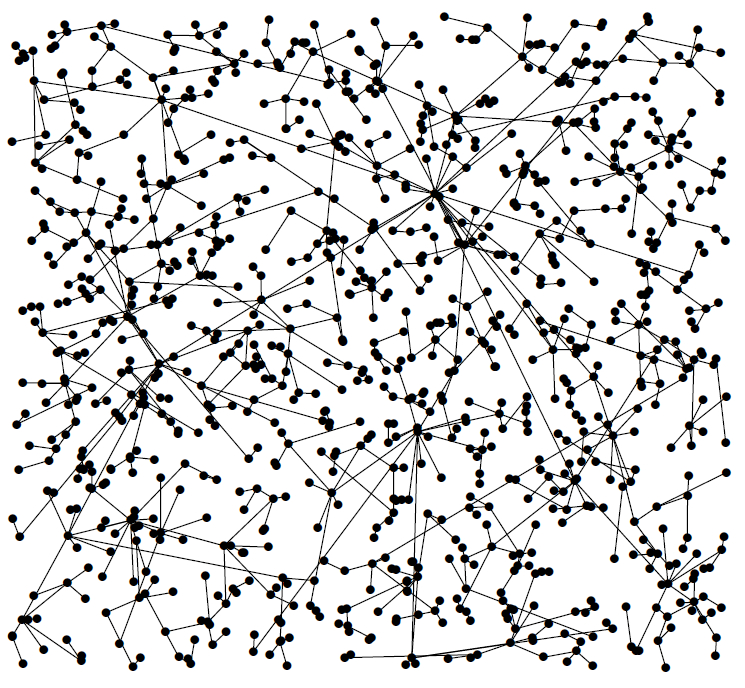
GPA graph with strong geometry
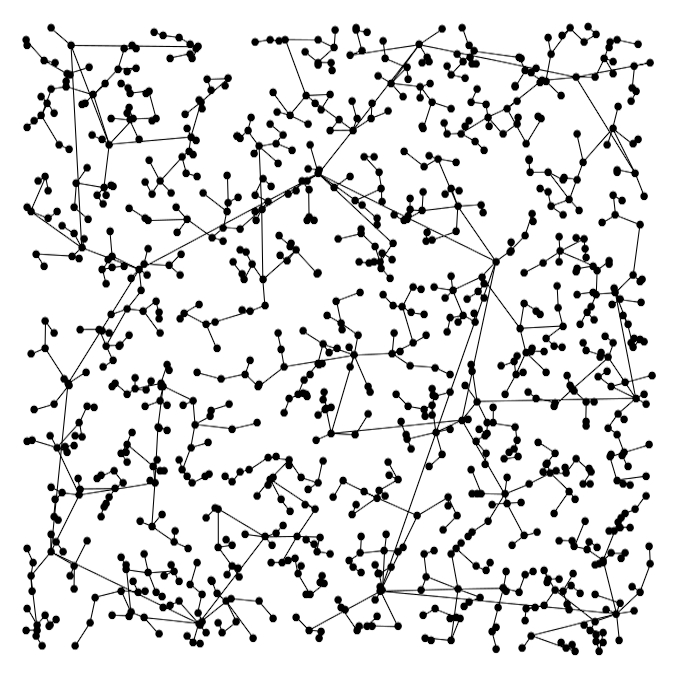
On-line nearest-neighbour graph