Statistical Methods for Spatial Data
Jonathan Cumming
Spatial data arise whenever observations are associated with geographical location. Typical examples include measurements of air pollution recorded at monitoring stations, outcomes aggregated over administrative areas (such as income or disease incidence), and the observed locations of events such as crimes, earthquakes or cases of infection.
In each case we observe values \(Y\) together with spatial locations \(s\). A defining feature of such data is that nearby observations tend to be related. Classical models that assume independence are therefore inadequate. The central question becomes:
How should spatial dependence be represented and modelled?
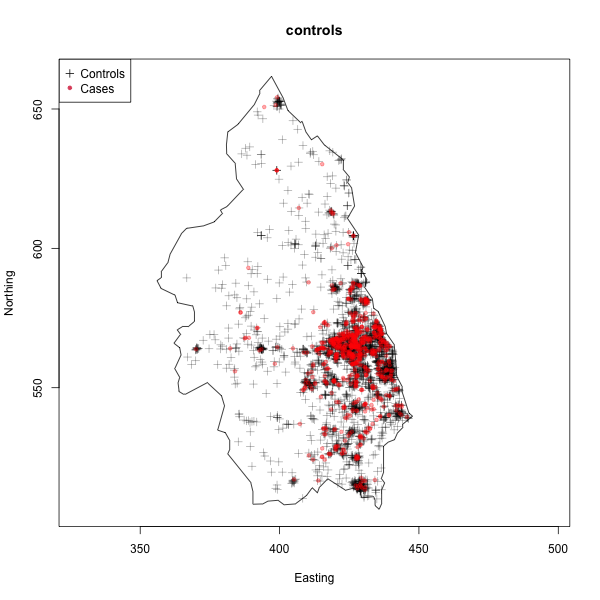
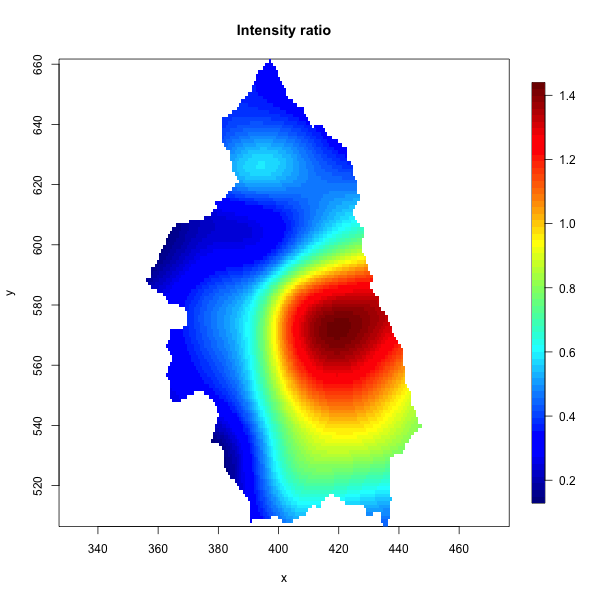
Cases of primary biliary cirrhosis and controls representing at-risk population (left) and intensity ratio (right) in north-eastern England between 1987 and 1994.
These maps illustrate two key features of spatial data: events occur at specific locations, and the underlying risk may vary across space. Different statistical frameworks emphasise different aspects of this structure. In this project we examine three principal paradigms:
- Point pattern data, where where the locations $s$ themselves are the primary objects of interest;
- Areal (lattice) data, where values $Y$ are observed but aggregated over discrete regions with a neighbourhood structure;
- Geostatistical data, where real-valued measurements $Y$ are recorded at spatial locations $s$ and we wish to use the spatial structure to interpolate or predict across space.
The project begins with a structured group exploration of these frameworks and the ideas that underpin them. In the individual component, each student will pursue one direction in greater depth.
Group Project
The group project provides a broad but coherent introduction to the modelling of spatial structure. The emphasis is on understanding how spatial dependence is defined, measured and incorporated into statistical models.
We begin with the nature of spatial structure: what distinguishes spatial from non-spatial data; first- and second-order structure; the role of proximity and neighbourhood; and exploratory visualisation of spatial datasets. We then examine three principal modelling frameworks.
Point pattern data. When data consist of event locations, we ask whether the observed pattern is consistent with spatial randomness, or whether clustering or inhibition is present. We introduce Complete Spatial Randomness, the idea of an intensity function, and basic exploratory and simulation-based techniques.
Areal data. When observations are aggregated over regions, spatial dependence is encoded through neighbourhood relationships. We examine adjacency structures and spatial graphs, measures of spatial autocorrelation (e.g. Moran’s $I$), and basic smoothing ideas for regional data.
Geostatistical data. When real-valued measurements are observed at spatial locations, we treat the data as a realisation of a spatial random field. We introduce covariance functions and stationarity (at a conceptual level), variograms and their interpretation, and the basic idea of spatial prediction and interpolation.
Throughout, the aim is comparative: how do these frameworks differ, what assumptions do they make, and how do they represent spatial dependence?
Expected outcomes
- Distinguish clearly between point pattern, areal and geostatistical data.
- Explain how spatial dependence is represented in each framework.
- Implement and interpret basic exploratory and modelling techniques in R.
- Critically compare modelling assumptions across the three paradigms.
Individual Project
In the individual component, each student will specialise in one of the three spatial frameworks and develop a more detailed investigation. This may involve further theoretical development, more sophisticated modelling, or a sustained analysis of a real dataset.
Point processes. Possible directions include:
- Poisson and inhomogeneous point processes;
- cluster and inhibition models;
- Monte Carlo tests for spatial structure;
- applications to ecological, epidemiological or urban data.
Areal models. Possible directions include:
- spatial autocorrelation in greater depth;
- conditional autoregressive (CAR) models;
- spatial smoothing for disease mapping;
- spatial regression for regional data.
Geostatistics. Possible directions include:
- modelling covariance structure and variograms;
- stationary and non-stationary models;
- kriging and spatial prediction;
- simulation of Gaussian random fields.
The individual investigation should demonstrate clear understanding of modelling assumptions, careful implementation, and thoughtful interpretation of results.
Mode of Operation and Evidence of Learning
This project revolves around developing conceptual understanding of spatial dependence through reading, discussion and implementation in R. The emphasis is on linking mathematical ideas to computational realisation and empirical behaviour.
- Read and synthesise material on spatial modelling frameworks.
- Implement core methodology in R (e.g. simulation of point processes, spatial autocorrelation measures, variogram estimation).
- Compare theoretical assumptions with behaviour observed in simulated data.
- Analyse both simulated and real spatial datasets.
- Critically evaluate modelling choices and their consequences.
- Communicate statistical reasoning clearly in written and oral form.
Understanding will be demonstrated through the ability to move fluently between mathematical description of spatial structure, computational implementation, empirical behaviour of models, and interpretation in the context of real data. The emphasis is on understanding how spatial dependence is encoded and why particular modelling choices are appropriate.
Pre-requisites
- Statistical Inference II - for familiarity with standard statistical ideas and experience with R.
- (optional) Statistical Modelling II - helpful for understanding simple statistical models, but not essential
Resources
- Moraga P, Spatial Statistics for Data Science: Theory and Practice with R, 2024.
- Cressie N, Statistics for Spatial Data, 1991
- Schabenberger O, Gotway CA, Statistical methods for spatial data analysis, 2005.
- Ripley BD, Spatial Statistics, 1981.
- R Packages: Analysis of Spatial Data
- Diggle P, Statistical analysis of spatial point patterns, 2003.