Statistical Analysis of Network Data
Jonathan Cumming
Many modern datasets describe relationships rather than individual measurements. Examples include social networks of friendships or interactions, collaboration networks between researchers, citation networks linking scientific papers, and biological networks representing interactions between genes or proteins.
In such situations the fundamental data are not attributes of individual observations but the connections between them. These systems are naturally represented as networks (or graphs), where entities are represented by nodes and relationships between them by edges.
Statistical network analysis seeks to explain patterns of connections between entities through models of how networks are formed.
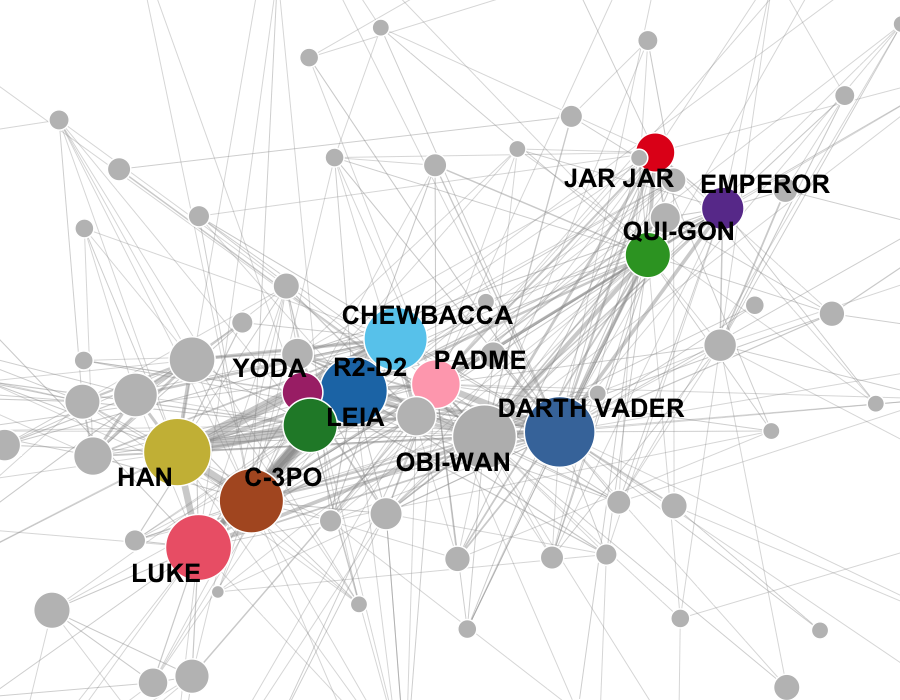
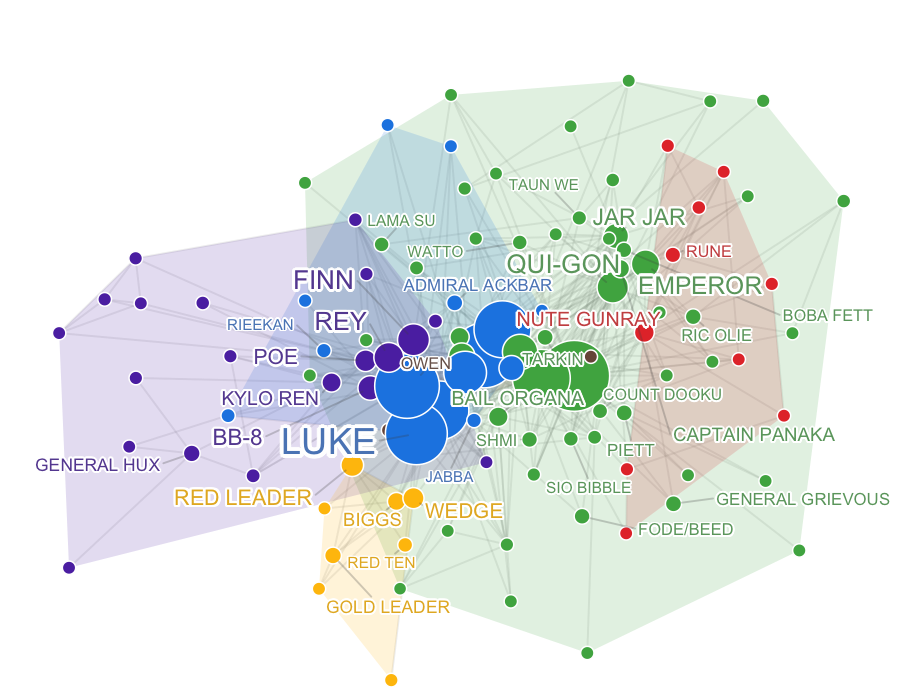
Example network based on interactions between characters in the Star Wars films (left), with nodes coloured by detected communities (right). Networks often exhibit clustered structure and highly connected “hub” nodes. Statistical models aim to explain how such patterns arise in real-world networks.
The project begins with a common exploration of how relational data can be represented and analysed statistically. Networks are typically stored as adjacency matrices or edge lists describing which nodes are connected. From this representation we can compute a range of descriptive summaries, such as the number of connections a node has (its degree), measures of centrality or importance, and indicators of clustering or community structure.
These exploratory tools provide an initial statistical view of the structure of a network. Many real networks contain groups of nodes that interact more frequently with each other than with the rest of the system. Such patterns suggest the presence of hidden structure, which can be formalised through statistical models.
A particularly important class of models are stochastic block models, which assume that nodes belong to latent groups and that the probability of a connection between two nodes depends on the groups to which they belong. These models provide a statistical framework for understanding community structure and hidden organisation in network data.
Possible directions for investigation
- Stochastic block models. Study statistical models in which nodes belong to latent groups and connection probabilities depend on group membership. Investigate estimation methods, interpretation of model parameters, and applications to real datasets.
- Community detection algorithms. Explore algorithmic approaches for identifying clusters or communities within networks (for example modularity optimisation, spectral clustering, or the Louvain algorithm) and compare their results with statistical models.
- Exponential random graph models (ERGMs). Investigate statistical models that describe network structure in terms of local patterns such as triangles, degree effects or homophily between nodes.
- Dynamic networks. Study networks that evolve over time, such as communication networks or interaction networks observed across multiple time periods.
- Link prediction. Develop statistical or machine-learning approaches for predicting missing or future connections in a network.
- Application-led investigation. Carry out a detailed statistical analysis of a real network dataset (e.g. social, biological or collaboration networks), focusing on modelling assumptions and interpretation of results.
Expected outcomes
- Explain how relational data can be represented and analysed as networks.
- Compute and interpret key descriptive summaries of network structure.
- Implement statistical models for network data using R.
- Investigate and interpret community structure in real networks.
- Communicate statistical findings clearly through visualisation and written explanation.
Mode of Operation and Evidence of Learning
This project revolves around developing statistical understanding of network data through reading, discussion, implementation in R, and analysis of simulated and real networks. The emphasis is on connecting structural features of relational data with statistical models that attempt to explain how such networks arise.
- Read and synthesise material on network representation, exploratory summaries, and statistical models for graphs.
- Implement core methods in R for network visualisation, descriptive analysis, simulation, and model fitting.
- Investigate how features such as degree variation, clustering, or community structure are reflected in different models.
- Compare empirical network structure with behaviour generated under stochastic network models.
- Analyse real network datasets with attention to interpretation, modelling assumptions, and limitations of the data.
- Critically evaluate alternative approaches to community detection, latent structure, or network formation.
- Communicate statistical findings clearly through diagrams, visualisation, written explanation, and oral discussion.
Understanding will be demonstrated through the ability to move fluently between graph-based representations of data, statistical summaries, computational modelling, and substantive interpretation of network structure. At Level 4, the emphasis is on independent critical judgement: selecting appropriate methods, recognising what patterns can and cannot be explained by a given model, and articulating the strengths and weaknesses of different statistical perspectives on network data.
Pre-requisites
- Statistical Inference II — familiarity with statistical ideas and experience with R.
Resources
- Kolaczyk, Statistical Analysis of Network Data: Methods and Models
- Kolaczyk & Csárdi, Statistical Analysis of Network Data with R
- Lusher, Koskinen, Robins, Exponential random graph models for social networks: theory, methods, and applications.
- Newman, Networks: An Introduction .
- R packages on Network Analysis and Graphs .
- igraph project: https://igraph.org .