Change point detection
Rachel Oughton
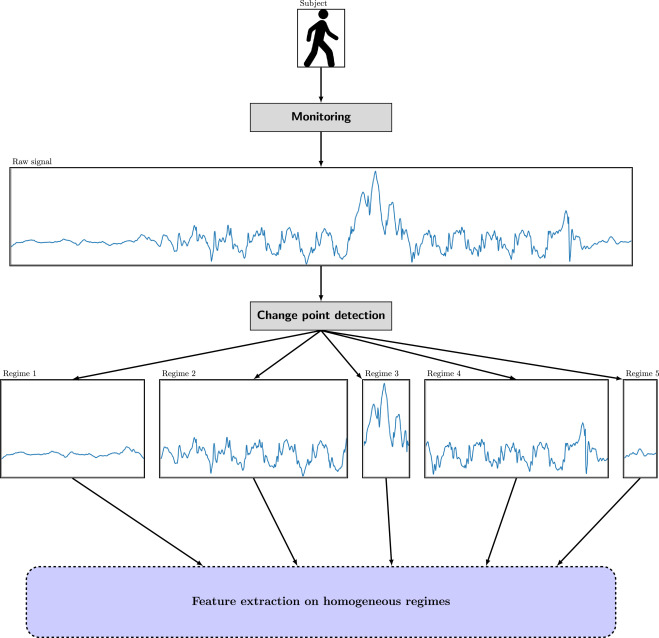
A Time series consists of variables measured sequentially at a set of time points. Often these are modelled as being generated by an ongoing process, such as a physical phenomenon, the economy or a person's health or behaviour. If there is a sudden change to this underlying process, the nature of the time series will change. In Change point detection, we try to indentify if/when, and how, the behaviour of the time series changes. This might be detecting the change from 'awake' to 'asleep' from a smart watch data, determining the start of an earthquake from seismic data, looking at the effect of global events such as Covid-19 or a financial crash on the stock market or detecting changes in a patient's vital statistics.
There are a number of important considerations to be made when detecting changes in behaviour:
- Is the analysis to be performed online (ie. as the data are received) or offline (ie. after the fact)?
- Is the number of change points, if any, known?
- Is the behaviour of the system in its various states well understood?
- What are the consequences of missing, or falsely detecting, a change point?
- Is the change totally abrupt, or more gradual?
In this project, you will study a variety of change point methods and apply them to real and synthetic data. There are many time series data sets available, for example at the Office for National Statistics or yahoo! finance, some of which will work well with change point analysis. There is also a collection of real world datasets chosen specifically as part of a study on change point analysis by the Alan Turing Institute.
There are a number of directions you could take with your project, such as
- Comparing the performance of different change point detection methods on example datasets
- Investigating a particular area, such as Bayesian change point detection or state-space models
- Looking into a related topic, such as anomaly detection
- Trying to build the best change point detection method for a particular dataset
In this project there will be a lot of data analysis and statistical computation. It is therefore essential to be familiar with the statistical package R, as well as general statistical and data analysis concepts.
Resources
If you'd like to read more about change point detection, here are some good starting points:
- ''An evaluation of change point detection algorithms'' focusses on testing algorithms on a selection of 37 real datasets, rather than synthetic data as is often the case. The datasets used in this study are available, and may be a useful place to start (or end!).
- ''A survey of methods for time series change point detection'' is a readable introduction to many of the consideations and methods of change point analysis.
- ''Change Point Detection in Time Series with R and Tableau'' gives an overview of change point detection in R, with some examples.
- ''Comparison of change point detection methods'' compares several methods on the Nile dataset (an inbuilt R dataset)
- ''Detection of Abrupt Changes - Theory and Application'' - a textbook now out of print
The R statistical package can be downloaded from CRAN or RStudio
.Prerequisites/Corequisites