Time series analysis
Rachel Oughton
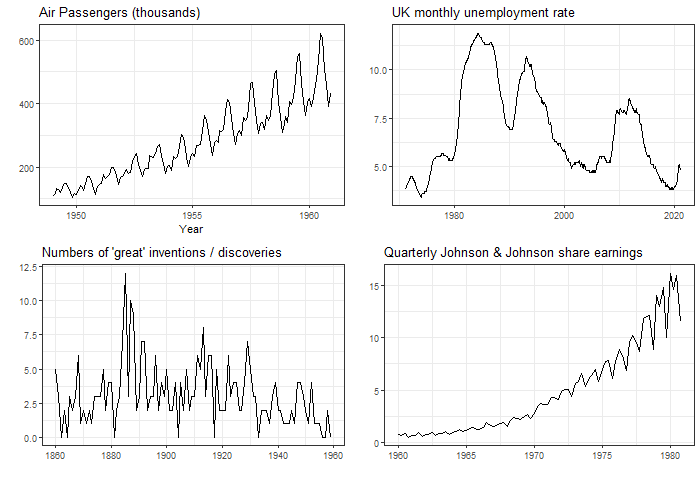
A Time series consists of variables measured sequentially at a set of time points. When working with time series, we usually treat time as the independent variable and seek to predict the observation’s behaviour as time progresses. Such datasets are found in almost every application of statistics; think of an a patient's diagnostic measurements, a company's share price of a company, rainfall or temperature, electricity demand, the daily number of Covid-19 cases, the number of Tweets featuring a particular hashtag. It is often important not just to know the behaviour at a particular time, but to understand how it behaves over time. Understanding how to work with time series data is therefore an extremely useful skill for a statistician to have!
The properties of time series are different from one to the next, and therefore different statistical methods will be appropriate for different applications. There may or may not be a general trend, or some periodic behaviour. The data may have been collected at regular or irregular intervals. Successive observations may or may not be correlated. The time series may be deterministic, where we have some reasonable physical (or similar) explanation for a trend, or stochastic where the behaviour seems random and inexplicable. These, and other characteristics, lead to many different time series models and methods.
Which method we use will depend not only on the nature of the time series, but on our intended outcome. One of the simplest and most intuitive methods for working with a deterministic, non-stationary time series is to use linear regression, with time as a dependent variable. By contrast, we may simulate the behaviour of a stochastic time series using a random walk. If there is autocorrelation we may use an autoregressive model, where terms are modelled using previous data, or spectral analysis, where the frequencies of the data are analysed.
In this project, you will study a variety of time series methods and apply them to real data. There are many time series data sets available, for example
- Environmental: the Environmental Information Data Centre, the National River Flow Archive
- Financial: Yahoo! finance
- Government: Office for National Statistics
There are a number of directions you could take with your project, such as
- Looking into decomposing a time series into its component parts
- Comparing different methods for modelling seasonality
- Focussing on one particular class of methods, for example ARIMA
- Working on developing the best possible time series model for a particular dataset
- Looking at different ways of detecting unusual or changing behaviour, such as change detection
- Investigating methods for using time series to learn about the underlying process, such as Hidden Markov models or Dynamic Bayesian networks.
In this project there will be a lot of data analysis and statistical computation. It is therefore essential to be familiar with the statistical package R, as well as general statistical and data analysis concepts.
Resources
There is a large amount of material available on the web; start with the wikipedia page for example, and the topics linked above.
R-bloggers has many interesting articles, such as The time series object and A Comprehensive Introduction to Handling Date & Time in R . There are also tutorials on Towards Data Science, for example Trends and Seasonality. Be aware that these tend to make heavy use of libraries at the expense of explaining the model or process, but they can be a good introduction to new functionality (especially exciting plots).
Time series will feature in many data science and statistics textbooks, but here are a few (you may have to go through the library website if these links require a login):
- Time series analysis and its applications: with R examples (Shumway and Stoffer) probably the gentlest, with some very good introductory content (this link was wrong but it should now go to the DU library page)
- Introductory time series with R (Cowpertwait and Metcalfe) - some well detailed examples with lots of R content
- Time series analysis (Hamilton) - quite advanced, but a good reference for particular methods
Prerequisites/Corequisites