6  Random variables

🥅 Goals
  1. Understand the definition of a random variable as a function on the sample space.

  2. Master the notation for events and probabilities of events relating to random variables.

  3. Know how to recognize a discrete random variable, how to identify its probability mass function, and how to derive probabilities of associated events.

  4. Know how to recognize a continuous real-valued random variable, how to identify its probability density function, and how to derive probabilities of associated events.

  5. Know the following distributions. This includes identifying the scenarios in which they hold, the assumptions behind them, and how to identify their parameters.

  • the binomial distribution
  • the geometric distributions
  • the Poisson distribution, including how and when it can be use to approximate a binomial distribution.
  • the uniform distribution.
  • the exponential distribution, and how it arises from the Poisson distribution.
  • the normal distribution, and how we can derive probabilities of events using its cumulative distribution function and standard normal tables.
  1. Work with functions of random variables.

In many experiments we are often interested in a numerical value rather than the elementary event \(\omega \in \Omega\) per se: for example, in the financial industry we may not care about the behaviour of the stock price throughout a given period, only whether it reached a certain level or not; in weather forecasting we may not be interested in the detailed variation of atmospheric pressure and temperature, only in how much rain is going to fall, and so on. These uncertain quantities associated with random scenarios have as their mathematical idealization the concept of random variable.

Put simply, a random variable is a function or mapping of the sample space: for each \(\omega \in \Omega\), the random variable \(X\) gives the output \(X(\omega)\). In this chapter, we study both discrete and continuous univariate random variables, and discuss some important examples: binomial, geometric, Poisson, uniform, exponential, and normal distributions. To enable practical calculations, we also discuss cumulative distribution functions, standard tables, and how probabilities behave under transformations.

6.1 Definition and notation

🔑 Key idea: Definition: random variable
A random variable on \(\Omega\) is a mapping from the sample space \(\Omega\) to some set of possible values \(X(\Omega) := \{ X(\omega) : \omega \in \Omega \}\): \[X: \Omega\to X (\Omega) \text{ given by } \omega \mapsto X(\omega).\]

Typically, we find ourselves in one of the following situations:

  • \(X(\Omega)\subseteq\mathbb{R}\), in which case we say that \(X\) is a real-valued random variable or a univariate random variable; or

  • \(X (\Omega) \subseteq\mathbb{R}^d\), in which case we say that \(X\) is a vector-valued random variable, or a multivariate random variable; in this case we can identify \(X\) with a vector \((X_1,\ldots,X_d)\) of real-valued random variables, where \(X_i(\omega):= [X(\omega)]_i\), that is, \(X_i(\omega)\) is the \(i\)th component of \(X(\omega)\).

For any \(B \subseteq X(\Omega)\), we write ‘\(X \in B\)’ to denote the event \(\{ \omega \in \Omega: X(\omega) \in B \}\). For any \(x\in X(\Omega)\), we write ‘\(X = x\)’ to mean the event \(X\in\{x\}\), that is, \(\{\omega \in \Omega: X(\omega) = x\}\). We sometimes also write \(\{X=x\}\) and \(\{X\in B\}\) to emphasize that these are sets.

For example, if we consider throwing two standard dice, with sample space \[\Omega=\{(i,j): i\in\{1,2,3,4,5,6\},\,j\in\{1,2,3,4,5,6\}\},\] then the sum of the numbers that show on the dice corresponds to a real-valued random variable \(X\) defined by: \[X(i,j):= i+j, \text{ for all } (i,j) \in \Omega.\]

Then the notation \(X=10\) denotes the event \(\{(4,6),(5,5),(6,4)\},\) and \(X\in[0,4]\) denotes the event \[\{(1,1),(1,2),(2,1),(1,3),(2,2),(3,1)\}.\]

💪 Try it out
Toss 3 fair coins, and let \(X\) denote the total number of heads.

  1. Describe the function \(X\) by tabulating its values:
\(\omega\) HHH HHT HTH THH HTT THT TTH TTT
\(X(\omega)\) - - - - - - - -
  1. Consider the events \[A_1 = \{ X = 2\}, ~ A_2 = \{ X \in [0,1.5] \}, ~\text{and}~ A_3 = \{ X \in [10,20] \} .\] To which subsets of \(\Omega\) do these events correspond? What are their probabilities?

Answer:

  1. The table of values of \(X\) looks like this:
\(\omega\) HHH HHT HTH THH HTT THT TTH TTT
\(X(\omega)\) 3 2 2 2 1 1 1 0
  1. We have that \[A_1 = \{ \omega \in \Omega : X(\omega) = 2 \} = \{ \text{HHT}, \text{HTH}, \text{THH} \} ,\] so, assuming all 8 outcomes are equally likely, \(\pr{ X = 2 } = 3/8\).

Similarly, \[A_2 = \{ \omega \in \Omega : 0 \leq X(\omega) \leq 1.5 \} = \{ \text{TTT}, \text{TTH}, \text{THT}, \text{HTT} \} ,\] so \(\pr { X \in [0,1.5] } = 4/8 = 1/2\), and \(A_3 = \emptyset\) so \(\pr{ X \in [10,20] } = 0\).

A simple but important class of random variable is formed by the indicator random variables, denoted for an event \(A \in \mathcal{F}\) by \(𝟙_{A}\) and given by the mapping \[𝟙_{A}(\omega)= \begin{cases} 1&\text{if }\omega\in A, \\ 0&\text{otherwise}. \end{cases}\] Note that \(\pr{𝟙_{A} = 1} = \pr{ \{ \omega \in \Omega : \omega \in A \} } = \pr{A}\) and \(\pr{𝟙_{A}=0} = 1-\pr{A}\).

Recall the definition of probability from Section 1.5. Given a probability distribution \(\pr{}\) on the sample space \(\Omega\), a random variable \(X:\Omega\to X (\Omega)\) induces a probability distribution \(\mathbb{P}_X(\cdot)\) on the sample space \(X (\Omega)\) as follows.

🔑 Key idea: Theorem: defining probailities
The function \(\mathbb{P}_X(\cdot)\), mapping sets \(B\subseteq X(\Omega)\) to a real number \(\mathbb{P}_X(B)\), defined by \[\mathbb{P}_X(B):= \pr{X\in B}=\pr{\{\omega \in \Omega: X(\omega) \in B\}},\] is a probability on \(X(\Omega)\), that is, \(\mathbb{P}_X(\cdot)\) satisfies the probability axioms (A1–A4).

Proof
The proof of this theorem is an exercise! It’s 6.17 on the problem sheet.

Advanced content
As mentioned in Chapter 1, in general sample spaces \(\Omega\) one cannot expect to be able to assign probabilities to every \(A \in 2^\Omega\), and one must restrict to some \(\mathcal{F} \subset 2^\Omega\) of ‘nice events’.

This has consequences for the definition of random variable we gave above, as can be gleaned by examination of the Theorem: we must have that \(\{ \omega \in \Omega : X(\omega) \in B \}\) is a genuine event in \(\mathcal{F}\), at least for a large enough class of \(B \subseteq X(\Omega)\) to tell us everything we would like to know about the random variable \(X\).

For real-valued random variables, the relevant \(B\) are the Borel sets: these are the members of the smallest \(\sigma\)-algebra on \(\mathbb{R}\) that contains all open intervals. Those of you who do Probability II (and later courses) will see that the relevant concept for a more complete definition of random variable is that of a measurable function.

📖 Textbook references

If you want more help with this section, check out:

6.2 Discrete random variables

The function \(\mathbb{P}_X(\cdot)\) tells us everything we might need to know about the random variable \(X\): it is called the distribution of \(X\). In general it is a large and unwieldy object, as we need a value of \(\mathbb{P}_X(B)\) for every \(B \subseteq X(\Omega)\). However, there are two special cases where we can give an efficient description of the distribution. The first is in the case of discrete random variables (the second, which we will see a little later, is the case of continuous random variables).

Recall that a set is countable if there exists a bijection between that set and a subset of the natural numbers \(\mathbb{N}\).

🔑 Key idea: definition: discrete random variable and probability mass function
A random variable \(X:\Omega\to X(\Omega)\) is said to be discrete when there is a finite or countable set of values \(\mathcal{X} \subseteq X(\Omega)\) such that \(\pr{ X \in \mathcal{X} } =1\). The function \(p() : \mathcal{X} \to [0,1]\) defined by \[p(x) = \pr { X = x}, \text{ for all } x \in \mathcal{X} ,\] is called the probability mass function of \(X\).

The fact that \(p(x) \in [0,1]\) is an immediate consequence of A1 and C4. Here are some further important properties of the probability mass function.

🔑 Key idea: probability mass functions for discrete random variables
Suppose that \(X\) is a discrete random variable and \(p(): \mathcal{X} \to [0,1]\) is its probability mass function. Then \[\pr{X\in B}=\sum_{x\in B}p(x), \text{ for all } B \subseteq \mathcal{X},\] and \[\sum_{x\in \mathcal{X}} p(x) =1.\]

Proof
Any \(A\subseteq \mathcal{X}\) is finite or countable (because it is a subset of a finite or countable set) and so \[\{X\in B\} = \bigcup_{x\in B} \{X=x\},\] where the union runs over a countable number of events. Thus we may apply A4 to get \[\begin{aligned} \pr{X \in B} =\sum_{x\in B} \pr{X=x} = \sum_{x \in B} p(x). \end{aligned}\] In particular, taking \(B = \mathcal{X}\) we get \(\sum_{x \in \mathcal{X}} p(x) = \pr { X \in \mathcal{X} } = 1\).

The probability mass function of a discrete random variable summarizes all information we have about \(X\). Specifically, it allows us to calculate the probability of every event of the form \(\{X\in B\}\).

In simple cases, the set \(\mathcal{X}\) is often just \(X(\Omega)\), but this definition is necessary to cover all cases. If the random variable under consideration is not clear from the context, we may write \(p_X()\) for the probability mass function of \(X\).

Theorem: alternative characterisation of discrete random variables

A random variable \(X:\Omega\to X(\Omega)\) is discrete whenever

  1. \(X(\Omega)\) is finite or countable, or
  2. \(\Omega\) is finite or countable.

Proof
Note that (ii) implies (i).

Then, if (i) holds, the statement is immediate from the definitition of a discrete random variable, since one can simply take \(\mathcal{X} = X(\Omega)\).

💪 Try it out
Continuing our previous example, toss three fair coins and let \(X\) be the total number of heads obtained. This example is discrete since the possible values are 0, 1, 2, 3. Examining the table, and grouping the 8 outcomes by the value of \(X\), we find that the probability mass function of \(X\) is

\(x\) 0 1 2 3
\(p(x)\) \(\frac{1}{8}\) \(\frac{3}{8}\) \(\frac{3}{8}\) \(\frac{1}{8}\)

For example, \[p(2) = \frac{| \{ \text{HHT}, \text{THH}, \text{HTH} \} |}{|\Omega|} = \frac{3}{8} .\] A quick way to get this is to observe that the number of ways of getting \(x\) heads is \(\binom{3}{x}\) so \(\pr{X = x} = \binom{3}{x} \frac{1}{8}\) for \(x \in X(\Omega)=\{0, 1, 2, 3\}\). We will see shortly that this is an example of the binomial distribution.

📖 Textbook references

If you want more help with this section, check out:

6.3 The binomial and geometric distributions

Consider the following random experiment, called a binomial scenario:

  • A sequence of \(n\) trials will be carried out, where \(n\) is known in advance of the experiment.

  • Trials are independent.

  • Each trial has only two outcomes, usually denoted ‘success’ or ‘failure’.

  • Each trial succeeds independently with the same probability \(p\).

Consider the random variable \(X\), the total number of successes in the \(n\) trials.

The usual sample space \(\Omega\) for the binomial scenario is the set of all the possible length-\(n\) sequences of successes and failures; if we represent a success by 1 and a failure by 0, then each \(\omega \in \Omega\) is a string \(\omega = \omega_1 \omega_2 \cdots \omega_n\) with each \(\omega_i \in \{0,1\}\). The random variable \(X\) takes values in \(X(\Omega):=\{0,1,\dots,n\}\), which is finite, so \(X\) is a discrete random variable. As a mapping on the sample space, we have \(X(\omega) = \sum_{i=1}^n \omega_i\), the total numbers of 1s in the string.

For each \(x\in\{0,1,\dots,n\}\):

  • because trials are independent (see the definition of independence of multiple events in Section 3.3), every sequence \(\omega\in\Omega\) with exactly \(x\) successes and \(n-x\) failures has probability \(\pr{\{\omega\}}=p^x (1-p)^{n-x}\); and

  • there are \(\binom{n}{x}\) sequences with exactly \(x\) successes.

By (C7), we can sum the probabilities of the outcomes in the event \[\{X=x\} = \{ \omega \in\Omega : \sum_{i} \omega_i = x\}\] to obtain \[p(x) =\pr{X=x} =\sum_{\omega \in\Omega : \sum_{i} \omega_i = x}\pr{\omega}.\] Putting everything together, the probability mass function of \(X\) is given by the following, which we take as a definition.

🔑 Key idea: Definition: binomial distribution
We say that a discrete random variable \(X\) is binomially distributed with parameters \(n\in\mathbb{N}\) and \(p\in[0,1]\), and we write \(X\sim\mathrm{Bin}(n,p)\), when \(\mathcal{X}=\{0,1,\dots,n\}\) and \[p(x)=\binom{n}{x}p^x(1-p)^{n-x}\text{ for all }x\in \{0,1,2,\ldots,n\}.\]

In the case of just a single trial (\(n=1\)), the binomial scenario is often referred to as a Bernoulli trial, and \(X\sim\mathrm{Bin}(1,p)\) is often referred to as a Bernoulli random variable with parameter \(p\).

Example
If we roll 4 fair cubic dice and let \(X\) be the number of 6s then \(\pr{X = x} = \binom{4}{x}\,(\frac1{6})^x (\frac5{6})^{4-x}\) so the probability mass function of \(X\) is \[\begin{aligned} p(0) = \frac{625}{1296} , \quad p(1) = \frac{500}{1296} , \quad p(2) = \frac{150}{1296} , \quad p(3) = \frac{20}{1296} , \quad p(4) = \frac{1}{1296}. \end{aligned}\] Hopefully you can see that these probabilities sum to 1.

💪 Try it out

105 people bought tickets for a flight. Each person independently has chance \(0.04\) of missing the flight. Find

  1. the probability that nobody misses the flight;

  2. the probability that three or more people miss the flight.

Answer:

Let \(X\) be the number of people that miss the flight. Then \(X\sim\mathrm{Bin}(105,0.04)\) so \[p(x)=\binom{105}{x} \cdot 0.04^x \cdot 0.96^{105-x} .\]

  1. We find that \(\pr{X=0}=p(0)=\binom{105}{0} \cdot 0.04^0 \cdot 0.96^{105}=0.96^{105}\approx 0.014\).

  2. The trick here is to apply (C2), so that \[\begin{aligned} \pr{X\ge 3} & = 1-\pr{X<3}=1-p(0)-p(1)-p(2), \end{aligned}\] where \[\begin{aligned} p(0) & \approx 0.014 \text{ as before}, \\ p(1) &= \binom{105}{1} \cdot 0.04^1 \cdot 0.96^{104} \approx 0.060 , \\ p(2) &= \binom{105}{2} \cdot 0.04^2 \cdot 0.96^{103} \approx 0.130, \end{aligned}\] so \(\pr{X \geq 3}\approx 0.796\).

Suppose that we extend the binomial scenario indefinitely, to an unlimited number of trials, and we repeat the trials until we obtain the first success. The (random) number of trials up to and including the first success is called the geometric distribution. Note that \[\begin{aligned} \pr{ \text{first success occurs on trial } n } & = \pr{ \text{first } n-1 \text{ trials are failure, then trail $n$ is a success} } \\ & (1-p)^{n-1} p ,\end{aligned}\] by independence of the trials and the definition of “independence of multiple events”. Note that, provided \(p > 0\), this is a probability distribution on \(\{1,2,3,\ldots\}\) because, by the geometric series formula, \[\sum_{n=1}^\infty (1-p)^{n-1} p = p \cdot \frac{1}{1-(1-p)} = 1 .\] Thus we are led to the following definition.

🔑 Key idea: Definition: geometric distribution
We say that a discrete random variable \(X\) is geometrically distributed with parameter \(p \in (0,1]\), and we write \(X\sim\mathrm{Geo}(p)\), when \(\mathcal{X} = \mathbb{N}:= \{1,2,3\ldots\}\) and \[p(x) = (1-p)^{x-1} p , \text{ for all } x \in \{1,2,3,\ldots \} .\]

📖 Textbook references

If you want more help with this section, check out:

6.4 The Poisson distribution

🔑 Key idea: Definition: Poisson distribution
We say that a discrete random variable \(X\) is Poisson distributed with parameter \(\lambda\), and we write \(X\sim\mathrm{Po}(\lambda)\), when \(\mathcal{X} = \mathbb{Z}_+ := \{0,1,2,\ldots\}\) and \[p(x)=\frac{e^{-\lambda}\lambda^x}{x!} \quad\text{for }x\in \mathbb{Z}_+.\]

The Poisson distribution is used to model counts of events which occur randomly in time at a constant average rate \(r\) per unit time, under some natural assumptions. Specifically, \[\pr{\text{event occurs in }(x, x+h)} \approx r h, \text{ for small } h.\] If \(X\) is the count of the number of events over a period of length \(t\) then it has distribution \(\mathrm{Po}(rt)\). Thus, the interpretation of the parameter \(\lambda\) in \(\mathrm{Po}(\lambda)\) is as the average number of events: we will return to this more formally later. Typical applications are

  • calls to a telephone exchange,

  • radioactive decay events,

  • jobs at a printer queue,

  • accidents at busy traffic intersections,

  • earthquakes at a tectonic boundary,

  • fish biting at an angler’s line.

💪 Try it out
From a particular fleet of aircraft, there have been 32 crashes over a 25-year period. Let \(W, M\), and \(Y\) denote the number of crashes in the next week, month, and year, respectively. Assume that a year has 365 days and that a month has 30 days. Suppose that crashes occur at random so that the number of crashes in a particular period can be modelled by a Poisson distribution.

  1. How are \(W, M\), and \(Y\) distributed?

  2. Find \(\pr{\text{no crashes in the next week}}\).

  3. Find \(\pr{\text{no crashes in the next month}}\).

  4. Find \(\pr{\text{no crashes in the next year}}\).

Answer:

For part (a), we compute the daily rate of crashes. 25 years is 9125 days. So the daily rate of crashes is \(r = \frac{32}{9125} \approx 0.0035\). In a week the average number of crashes is \(7 \cdot \frac{32}{9125}\), so \(W\sim\mathrm{Po}(\frac{7 \cdot 32}{9125})\). Similarly, \(M\sim\mathrm{Po}(\frac{30 \cdot 32}{9125})\) and \(Y\sim\mathrm{Po}(\frac{365 \cdot 32}{9125})\).

For part (b), the probability that a \(\mathrm{Po}(\lambda)\) random variable takes value \(0\) is \(e^{-\lambda}\). So \(\pr{W=0} = e^{-\frac{7 \cdot 32}{9125}} \approx 0.976\).

Similarly, for part (c) we get \(\pr{M=0} = e^{-\frac{30 \cdot 32}{9125}} \approx 0.900\), and for part (d) we get \(\pr{Y=0} = e^{-\frac{365 \cdot 32}{9125}} \approx 0.278\).

Another situation where the Poisson distribution arises is as an approximation to the binomial distribution when \(p\) is small and \(n\) is large, i.e., events are rare. More precisely, we have the following result.

🔑 Key idea: Theorem: Poisson approximation for Binomial distributions
Consider any \(\lambda>0\). Let \(X_n\sim\mathrm{Bin}(n,p_n)\) where \(\lim_{n\to\infty} n p_n = \lambda\), and let \(Y\sim\mathrm{Po}(\lambda)\). Then for all \(x\in\mathbb{Z}_+\), \[\lim_{n\to\infty}p_{X_n}(x)=p_Y(x).\] We describe this by saying that \(X_n\) converges in distribution to \(Y\).

Proof
Note that since \(np_n \to \lambda\), we have \(p_n \to 0\). For fixed \(x\) we have that, for \(n \geq x\), \[\begin{aligned} \pr{ X_n = x} = \binom{n}{x} (p_n)^x (1- p_n)^{n-x } & = n^{-x} \frac{n!}{(n-x)! x!} \left( n p_n \right)^x \left(1 - p_n \right)^{n-x} ,\end{aligned}\] where we observe that, by some calculus of limits, \[\begin{aligned} \lim_{n\to\infty} \left( n p_n \right)^x & = \lambda^x , \\ \lim_{n \to \infty} n^{-x} \frac{n!}{(n-x)!} & = \lim_{n\to\infty} \frac{n}{n} \cdot \frac{n-1}{n} \cdots \frac{n-x+1}{n} = 1 , \\ \lim_{n \to \infty} (1 - p_n)^{n} & = \lim_{n \to \infty} \left( 1 - \frac{np_n}{n} \right)^{n} = e^{-\lambda} , \\ \lim_{n\to\infty} (1 - p_n)^{-x} & =1 .\end{aligned}\] Collecting up terms gives \[\lim_{n \to \infty} \pr{ X_n = x} = \frac{e^{-\lambda} \lambda^x}{x!} ,\] as claimed.

This means that if \(X \sim \mathrm{Bin}(n,p),\) where \(n\) is large and \(p\) is small, then approximately \(X \sim \mathrm{Po}(np)\). As a rule of thumb, with \(p \leq 0.05\), we find \(n=20\) gives a reasonable approximation, while \(n = 100\) gives a good approximation. The approximation is useful when it allows us to sidestep calculating \(\binom{n}{x}\) for large values of \(n\) and \(x\).

Example
A typist produces a page of 1000 symbols but has probability 0.001 of mistyping any single symbol and such errors are independent (note: neither assumption is particularly realistic). The probability that a page contains more than two mistakes is \(\pr{X > 2}\) where \(X\) is the number of mistakes on the page.

We can use a Binomial distribution: \(X\sim\mathrm{Bin}(1000,0.001)\). As \(n\) is large and \(p\) is small, we approximately have that \(X\sim\mathrm{Po}(1000\times 0.001)=\mathrm{Po}(1)\). Therefore, \[\pr{X > 2} = 1 - \pr{X \leq 2} \approx 1 - e^{-1} \left( \frac{1^0}{0!} + \frac{1^1}{1!} + \frac{1^2}{2!} \right) \approx 0.0803.\]

💪 Try it out
From 1979 to 1981, 1103 Bristol postmen reported 245 dog-biting incidents (the dogs biting the postmen, that is). In all 191 postmen were bitten, 145 of them just once. Are these numbers consistent with dogs attacking postmen at random?

Answer:

Let \(X\) = number of incidents suffered by a particular postman. Supposing that dogs attack at random, then each of the \(245\) incidents is a random trial, where our postman has chance \(1/1103\) to be involved. So \(X\sim\mathrm{Bin}(245,1/1103)\). This is suitable for a Poisson approximation with \(\lambda = n p = \frac{245}{1103} \approx 0.222\). Approximately, \(X\sim\mathrm{Po}(0.222)\), and then \[\begin{aligned} \pr{X=0}&\approx e^{-0.222}\approx 0.80, \\ \pr{X=1}&\approx 0.222 e^{-0.222}\approx 0.18, \\ \pr{X\ge 2}&\approx 1-0.80-0.18 =0.02. \end{aligned}\] Compare this to the observed data for the proportion of postmen who were \[\begin{aligned} \text{not attacked: }& \frac{1103 - 191}{1103} \approx 0.83, \\ \text{once attacked: }& \frac{145}{1103} \approx 0.13, \\ \text{more than once attacked: }& \frac{191-145}{1103} \approx 0.04. \end{aligned}\] This looks like a reasonably good fit. One can test this using a goodness of fit test that you may have seen in Statistics courses.

📖 Textbook references

If you want more help with this section, check out:

6.5 Continuous random variables

🔑 Key idea: Definition: continuous random variables
Consider a real-valued random variable \(X:\Omega\to\mathbb{R}\). We say that \(X\) is a continuous random variable, or that \(X\) has a continuous probability distribution, or that \(X\) is continuously distributed, when there is a non-negative function \(f:\mathbb{R}\to\mathbb{R}\) such that \[\pr{X\in [a,b]}=\int_a^b f(t)\,\mathrm{d} t, \tag{6.1}\] for all \([a,b]\subseteq\mathbb{R}\). In this case, \(f\) is called the probability density function of \(X\).

If \(X\) is continuously distributed, then taking \(a=b=x\) in Equation 6.1 we see that \(\pr{X=x}=0\) for all \(x\in\mathbb{R}\), and so for any \(a <b\) we have \[\pr{X\in[a,b]}=\pr{X\in[a,b)}=\pr{X\in(a,b]}=\pr{X\in(a,b)}.\] Roughly speaking, \(f(x)\) has the interpretation \[ \pr{X\in [x,x+ \,\mathrm{d} x]} = f(x) \,\mathrm{d} x, \text{ for all $x$ at which $f$ is continuous}. \tag{6.2}\] All of the continuous random variables that we will see in this course have a probability density function that is piecewise continuous.

If the random variable under consideration is not clear from the context, we may write \(f_X(\cdot)\) for the probability density function of \(X\).

Advanced content
A probability density function satisfying Equation 6.1 is not quite unique. In fact, we can change the value of \(f(x)\) at countably many \(x\) and not affect Equation 6.1. For example, the two probability density functions \[f_1(x) = \begin{cases} 1 & \text{if } 0 \leq x \leq 1, \\ 0 & \text{otherwise} , \end{cases}, \text{ and } f_2(x) = \begin{cases} 1 & \text{if } 0 < x < 1, \\ 0 & \text{otherwise} , \end{cases},\] both integrate to \(1\) and both give rise to the same distribution, i.e., the same collection of \(\pr{X\in B}\) over sensible sets \(B\).

The probability density function of a random variable determines its probability distribution for all events in a reasonable collection of subsets of \(\mathbb{R}\) (but not all subsets of \(\mathbb{R}\)). The relevant concept here is again that of a \(\sigma\)-algebra. We will not give the exact definition of this \(\sigma\)-algebra here, but events of the following type can be assigned probabilities.

🔑 Key idea: Theorem: density functions determine probabilities
If \(X\) is continuously distributed with probability density function \(f(\cdot)\), then for any \(B\subseteq \mathbb{R}\) that is a finite union of intervals, \[\pr{X\in B}=\int_B f(x)\,\mathrm{d} x.\]

The probability density function of a continuous random variable summarizes practically all information we have about \(X\). Specifically, it allows us to calculate the probability of every event of the form \(\{X\in B\}\) where \(B\) is a finite union of intervals.

Advanced content
The conclusion of this theorem can be extended to all \(B\) in the Borel \(\sigma\)-algebra, which is the smallest \(\sigma\)-algebra on \(\mathbb{R}\) that contains all intervals. Pretty much every subset of \(\mathbb{R}\) that you will ever encounter is Borel.

Note that we can also evaluate probabilities of unbounded intervals: \[\begin{aligned} \pr{ -\infty < X \leq b} & = \int_{-\infty}^b f(x) \,\mathrm{d} x ;\\ \pr{ a \leq X < \infty } & = \int_a^\infty f(x) \,\mathrm{d} x ;\\ \pr{ -\infty < X < \infty } & = \int_{-\infty}^\infty f(x) \,\mathrm{d} x = 1 .\end{aligned}\] To see this, we can for example use (C9) (continuity along monotone limits) to get \[\begin{aligned} \pr { a \leq X < \infty} & = \pr { \cup_{n=1}^\infty \{ a \leq X \leq a+n \} } \\ & = \lim_{n \to \infty} \pr { a \leq X \leq a + n} \\ & = \lim_{n \to \infty} \int_a^{a+n} f(x) \,\mathrm{d} x \\ & = \int_a^\infty f(x) \,\mathrm{d} x ,\end{aligned}\] as claimed. In particular, we recover a version of (C10) for probability density functions:

Theorem: Corollary: densities integrate to one
Let \(X\) be a continuous random variable. Then its probability density function \(f(\cdot)\) integrates to one: \[\int_{-\infty}^{\infty}f(x)\,\mathrm{d} x=1.\]

💪 Try it out
Suppose that a continuous random variable \(X\) has probability density given by \(f(x) = kx\) for \(x \in [0,2]\), where \(k\) is some constant, and \(f(x) = 0\) for \(x \notin [0, 2]\). Find \(k\) and then compute \(\pr{X \in [0,1]}\).

Answer:

To find \(k\), we use the fact that the density integrates to one: \[1 = \int_{-\infty}^{\infty}f(x)\,\mathrm{d} x = \int_{0}^{2}kx\,\mathrm{d} x = 2k ,\] and therefore \(k=1/2\). With \(B = [0, 1]\), we have \(\pr{X\in B} = \int_{0}^{1} x/2 \,\mathrm{d} x = 1/4\).

💪 Try it out
Suppose that a continuous random variable \(X\) has probability density given by \[f(x) = \begin{cases} k(1+x) &\text{if }-1 \leq x < 0, \\ k(2-x) &\text{if }0 \leq x \leq 2, \\ 0 &\text{elsewhere}, \end{cases}\] where \(k\) is some constant. Find \(k\) and then compute \(\pr{X \in [0,1]}\).

Answer:

To find \(k\), note that \[\begin{aligned} 1 &= \int_{-\infty}^{\infty}f(x)\,\mathrm{d} x \\ &= \int_{-1}^0 k(1+x)\,\mathrm{d} x + \int_{0}^{2}k(2-x)\,\mathrm{d} x \\ &= k\left[x+\frac{x^2}{2} \right]_{-1}^0 + k \left[2x-\frac{x^2}{2}\right]_0^2 \\ &= \frac{k}{2} + 2k = \frac{5k}{2}, \end{aligned}\] so \(k= 2/5\). Then \[\begin{aligned} \pr{X\in [0,1]} &= \int_{0}^{1} \frac{2}{5} (2-x) \,\mathrm{d} x = \frac{2}{5} \left[2x - \frac{x^2}{2} \right]_0^1 = \frac{3}{5} . \end{aligned}\]

There are random variables that are neither discrete nor continuous, but they do not arise in practice very often. Can you think how to construct one? We will return to this briefly in Section 6.9.

📖 Textbook references

If you want more help with this section, check out:

6.6 The uniform distribution

🔑 Key idea: Definition: uniform distribution
Let \(a\) and \(b\) be real numbers with \(a < b\). We say a continuous random variable \(X\) is uniformly distributed on \([a,b]\), and we write \(X \sim \mathrm{U}(a,b)\), when \[f(x) = \begin{cases} 1/(b-a)&\text{for all }x\in[a,b], \\ 0 & \text{elsewhere}. \end{cases}\]

When \(X \sim \mathrm{U}(a,b)\) then \(X\) can take any value in the continuous range of values from \(a\) to \(b\) and the probability of finding \(X\) in any interval \([x,x+h]\subseteq [a,b]\) does not depend on \(x\).

💪 Try it out
Suppose that \(X\sim\mathrm{U}(0,3)\). What is \(\pr{X \leq 1}\)?

Answer:

We compute \[\pr{X \leq 1} = \int_{-\infty}^1 f(x) \,\mathrm{d} x = \int_0^1 \frac{1}{3} \,\mathrm{d} x = \frac{1}{3} . \]

📖 Textbook references

If you want more help with this section, check out:

6.7 The exponential distribution

Suppose a bell chimes randomly in time at rate \(\beta >0\). Let \(T > 0\) denote the time of the first chime (a random variable). The events {no chimes in \([0, \tau]\)} and \(\{T > \tau\}\) are the same. We know that the number of chimes in the interval \([0,\tau]\) is \(\mathrm{Po}(\beta \tau)\) and so the probability of no chimes is \(e^{-\beta \tau}\). Hence \[\pr{T > \tau} = e^{-\beta \tau} \quad\mbox{or}\quad \pr{T \leq \tau} = 1 - e^{-\beta \tau} \quad\text{for all } \tau \geq 0\] As \(1 - e^{-\beta \tau} = \int_0^\tau \beta e^{-\beta t}\,\mathrm{d} t\) we see that \(T\) is a continuous random variable with probability density function \(f(t) = \beta e^{-\beta t}\) for all \(t\ge 0\).

🔑 Key idea: Definition: exponential distribution
Let \(\beta >0\). We say a continuous random variable \(X\) is exponentially distributed with parameter \(\beta\), and we write \(X\sim\mathcal{E}(\beta)\), when \[f(x) = \begin{cases} \beta e^{-\beta x}&\text{for all }x\ge 0, \\ 0 & \text{elsewhere}. \end{cases}\]

📖 Textbook references

If you want more help with this section, check out:

6.8 The normal distribution

The normal distribution is one of the most important probability distributions for several reasons, some of which we will see later in this course. As fate would have it, its density is also a little more complicated.

🔑 Key idea: Definition: normal distribution
Let \(\mu\), \(\sigma\) be real numbers with \(\sigma > 0\). We say a continuous random variable \(X\) is normally distributed with parameters \(\mu\) and \(\sigma^2\), and we write \(X \sim \mathcal{N}(\mu,\sigma^2)\), when \[f(x)= \frac{1}{\sigma\sqrt{2\pi}}\, e^{-\frac{1}{2}\left( \frac{x-\mu}{\sigma} \right)^2 } \text{ for all }x\in\mathbb{R}.\]

The normal distribution is also sometimes called the Gaussian distribution. The probability density function of the normal distribution is bell shaped. Roughly speaking, the parameter \(\mu\) determines the location of the bell, and \(\sigma\) determines the spread of the bell: for smaller \(\sigma\), the bell is narrower. The relevant formal concepts are expectation and standard deviation, which will be introduced later on.

Unfortunately, there is no closed analytical form for \(\pr{X\in[a,b]}=\int_a^bf(x)\,\mathrm{d} x\) when \(X\) is normally distributed.

We can compute \(\pr{X \in [a,b]}\) by numerical integration, but we would like a quick reference to these computations. This looks unwieldy, since there are four parameters upon which \(\pr{X \in [a,b]}\) depends: \(a\), \(b\), \(\mu\), and \(\sigma\). We show by a series of steps how to reduce everything to a single parameter, so that values can be easily tabulated. The relevant concepts that we will need to carry out this simplification are the cumulative distribution function, and transformations of random variables. Both of these concepts are important for many other applications too, so we spend a little time on them.

📖 Textbook references

If you want more help with this section, check out:

6.9 Cumulative distribution functions

🔑 Key idea: Definition: cumulative distribution function
For any real-valued random variable \(X\), the function \(F\colon\mathbb{R}\to [0,1]\) defined by \[F(x):= \pr{X\leq x} \text{ for }x\in\mathbb{R}\] is called the cumulative distribution function of \(X\).

If the random variable under consideration is not clear from the context, we may write \(F_X\) for the cumulative distribution function of \(X\).

By (C1), it follows that \[\pr{X\in (a,b]}=\pr{X \leq b}- \pr{X \leq a} = F(b) - F(a).\] Now for a continuous random variable \(X\) this is the same as \(\pr{X \in (a,b)}\), \(\pr { X \in [a,b]}\), and so on, so knowledge of the cumulative distribution function is sufficient to calculate the probability of virtually any event of practical interest, that is, any finite union of intervals. This is also true for the discrete case, but is a little more complicated as it requires a limiting procedure. The continuous case is thus somewhat simpler, so we start with that.

🔑 Key idea: Theorem: cumulative distribution functions and probability density functions
Suppose that \(X\) is a continuously distributed random variable on \(\mathbb{R}\) with probability density function \(f(\cdot)\). Then \(F(\cdot)\) is a continuous function and, for all \(x \in \mathbb{R}\), \[\begin{aligned} F(x) &= \int_{-\infty}^x f(t)\,\mathrm{d} t, & f(x) &= \frac{\,\mathrm{d} F}{\,\mathrm{d} x}(x)\text{ when $f(\cdot)$ is continuous at $x$}.\end{aligned} \tag{6.3}\]

Proof
The first equality follows from the definition of continuous random variables, and it implies that \(F\) is continuous. Then the second equality is a consequence of the fundamental theorem of calculus (correspondence between derivative and integral).

💪 Try it out
Recall from the final example in Section 6.5 that we have a continuous random variable \(X\) with a piecewise continuous density given by \[f(x) = \begin{cases} \frac{2}{5} (1+x) & \text{if } -1 \leq x \leq 0 ,\\ \frac{2}{5} (2-x) & \text{if } 0 < x \leq 2,\\ 0 &\text{elsewhere.} \end{cases}\] Find \(F(x)\) for all \(x \in \mathbb{R}\), and use it to calculate \(\pr{ 0 \leq X \leq 1}\).

Answer:

Since \(f(\cdot)\) is defined piecewise, we must compute \(F\) piecewise too, always using \(F(x) = \int_{-\infty}^x f(t)\,\mathrm{d} t\). The sensible way to do this is to work ‘left to right’, since then we can use the fact that for \(x > x_0\), \[F(x) = \int_{-\infty}^{x_0} f(t) \,\mathrm{d} t + \int_{x_0}^x f(t) \,\mathrm{d} t = F(x_0) + \int_{x_0}^x f(t) \,\mathrm{d} t ,\] where we choose \(x_0\) to correspond to the piecewise definition of \(f(\cdot)\). To start with, for \(x \leq -1\), \(F(x) = \int_{-\infty}^x 0 \,\mathrm{d} t = 0\). Next suppose that \(-1 \leq x \leq 0\). Then \[\begin{aligned} F(x) & = F(-1) + \int_{-1}^x \frac{2}{5} (1 +t) \,\mathrm{d} t \\ & = 0 + \frac{2}{5} \left[ t + \frac{t^2}{2} \right]_{-1}^x = \frac{1}{5} (x+1)^2 .\end{aligned}\] Now suppose that \(0 \leq x \leq 2\). Then \[\begin{aligned} F(x) & = F(0) + \int_0^x \frac{2}{5} (2-t) \,\mathrm{d} t \\ & = \frac{1}{5} + \frac{2}{5} \left[ 2t - \frac{t^2}{2} \right]_0^x \\ & = 1 - \frac{(x-2)^2}{5} .\end{aligned}\] Finally, if \(x \geq 2\), \[F(x) = F(2) + \int_2^x 0 \,\mathrm{d} t = F(2) = 1 .\] So we conclude that \[F(x) = \begin{cases} 0 & \text{if } x \leq -1,\\ \frac{(x+1)^2}{5} & \text{if } -1 \leq x \leq 0 ,\\ 1 - \frac{(x-2)^2}{5} & \text{if } 0 \leq x \leq 2, \\ 1 & \text{if } x \geq 2 .\end{cases}\] Note that, as expected, \(F\) is continuous everywhere and differentiable at all but finitely many points.

Now, since \(X\) is continuous, \[\begin{aligned} \pr{ 0 \leq X \leq 1 } & = \pr { 0 < X \leq 1 } \\ & = \pr { X \leq 1 } - \pr{ X \leq 0 } \\ & = F(1) - F(0) \\ & = \frac{4}{5} - \frac{1}{5} = \frac{3}{5} . \end{aligned}\]

💪 Try it out
Recall from the first example in Section Section 6.5 that the continuous random variable \(X\) has \(f(x) = x/2\) for \(x\in[0,2]\) and \(f(x)=0\) elsewhere. By the same method as the previous example, the cumulative distribution function is \[F(x) =\int_{-\infty}^x f(t)\,\mathrm{d} t = \begin{cases} 0 & \text{if }x<0, \\ x^2/4 & \text{if }x\in[0,2], \\ 1 & \text{if }x>2. \end{cases} \]

Now let us move on to the case of a discrete random variable. Let us start with an example.

Example
Suppose \(X\) is a discrete random variable taking values in \(\{0,1,4\}\) with \(p(0) = \frac{1}{2}\), \(p(1)=p(4)=\frac{1}{4}\). Now \(F(x) = \pr{ X \leq x}\) so that \(F(x) =0\) for \(x < 0\). At \(x=0\), we have \(F(0) = \pr{ X \leq 0 } = p(0) = \frac{1}{2}\), so the cumulative distribution function jumps and the magnitude of the jump is the value of the probability mass function at that point. This is the general picture. Then \(F(x) = \frac{1}{2}\) for all \(x \in [0,1)\), until \(F(1) = p(0)+p(1) = \frac{3}{4}\). Continuing, we get \[F(x) = \begin{cases} 0 & \text{if } x < 0,\\ \frac{1}{2} & \text{if } 0 \leq x < 1,\\ \frac{3}{4} & \text{if } 1 \leq x < 4,\\ 1 & \text{if } x \geq 4.\end{cases} \]

🔑 Key idea: Theorem: properties of discrete cdfs
If \(X\) is a discrete real-valued random variable with probability mass function \(p()\), then \(F\) is piecewise constant, and \[\begin{aligned} F(x) & = \sum_{t\colon t \leq x} p(t) & p(x) &= F(x)- F(x^-). &\end{aligned}\] Here \(F(x^-)\) means the limit from the left \(F(x^-) = \lim_{y \uparrow x} F(y)\).

Proof
The first equality follows from the definition of discrete random variables.. Now \[p(x) = \pr { X = x} = \pr{ \{ X \leq x \} \backslash \{ X < x \} } = F(x) - \pr { X < x } .\] Let \(x_n\) be an increasing sequence with \(x_n < x\) and \(x_n \to x\). Then to prove the theorem it is enough to show that \[\pr { X < x } = F(x^-) = \lim_{n\to\infty} F(x_n).\] Note that since \(x_{n+1} > x_n\), \(F(x_{n}) \leq F(x_{n+1}) \leq 1\), so \(F(x_n)\) is bounded and increasing, so the limit does exist. Moreover, \(X < x\) if and only if \(X \leq x_n\) for some \(n\) in \(\mathbb{N}\), i.e., \[\pr { X < x } = \pr { \cup_{n =1}^\infty \{ X \leq x_n \} } = \lim_{n \to \infty} \pr { X \leq x_n } ,\] by C9 (continuity along monotone limits), because the events \(A_n = \{ X \leq x_n \}\) are increasing in \(n\). But \(\pr {X \leq x_n} =F(x_n)\) and we are done.

We state a result on the properties of the cumulative distribution function in general, that are already apparent from our examples in the special cases of discrete and continuous random variables.

Theorem: properties of continuous cdfs
Let \(F\) be the cumulative distribution function of a real-valued random variable. Then \(F\) has the following properties.

F1: \(\lim_{t\to-\infty} F(t) = 0\) and \(\lim_{t\to+\infty} F(t) = 1\).

F2: Monotonicity. For any \(s \leq t\), \(F(s) \leq F(t)\).

F3: Right-continuity. For any \(t \in \mathbb{R}\), \(F(t) = F(t^+)\) where \(F(t^+)\) is the limit from the right \(F(t^+) = \lim_{s \downarrow t} F(s)\).

We do not give the proof here, but you can try to prove this or consult the recommended text books.

We have already seen, in the discrete and continuous cases, that we can recover the probability mass function and probability density function, respectively, from the cumulative distribution function. In other words, the cumulative distribution function determines the distribution. This is true in general.

Theorem: cdfs determine distributions

The cumulative distribution function \(F\) of a real-valued random variable \(X\) completely determines the distribution of \(X\).

Advanced content
In general this means that \(F\) determines \(\pr{ X \in B}\) for all Borel sets \(B\).

Now we can see that there are some cumulative distribution functions that correspond to random variables that are neither discrete nor continuous. For example, we might have some jumps but also some continuously increasing parts. There are even examples where the cumulative distribution function is continuous but no probability density function exists: these singular distributions are quite pathological and rarely occur in practice.

📖 Textbook references

If you want more help with this section, check out:

6.10 Standard normal tables

Definition: standard normal distribution
A continuous random variable \(Z\) is standard normally distributed when \(Z\sim\mathcal{N}(0,1)\).

In other words, a standard normal is normal with \(\mu = 0\) and \(\sigma = 1\).

Because the standard normal distribution plays such a central role in many practical probability calculations, we use a special symbol to denote its probability density function and cumulative distribution function:1 \[\begin{aligned} \phi(z)&:= f(z)=\frac{1}{\sqrt{2\pi}}\, e^{-z^2/2}, & \Phi(z)&:= F(z)=\int_{-\infty}^z \phi(t)\,\mathrm{d} t.\end{aligned}\]

As already mentioned, \(\Phi\) has no closed analytical form, however, it can be tabulated. Such tabulation is called a standard normal table. Because \(\phi(z) = \phi(-z)\), it follows that \(\Phi(z) = 1 - \Phi(-z)\), and so we only need to tabulate \(\Phi\) for non-negative values of \(z\). Some values that are often useful are:

\(z\) \(0\) \(1.28\) \(1.64\) \(1.96\) \(2.58\)
\(\Phi(z)\) \(0.5\) \(0.9\) \(0.95\) \(0.975\) \(0.995\)

💪 Try it out
Suppose \(Z\sim\mathcal{N}(0,1)\). Calculate \(\pr{-1.28\le Z\le 1.64}\).

Answer:

We compute, making good use of symmetry, \[\begin{aligned} \pr{-1.28\le Z\le 1.64} &= \pr{Z \leq 1.64} - \pr{Z \leq -1.28} \\ & =\pr{Z \leq 1.64} - \pr { Z \geq 1.28 }\\ & = \pr{Z \leq 1.64}- \left(1-\pr{Z \leq 1.28} \right) \\ & = \Phi(1.64)-(1-\Phi(1.28)) \\ &= 0.95-(1-0.9)=0.85. \end{aligned}\]

We can use normal tables for \(\Phi\) to also calculate \(\pr{X\in[a,b]}\) for any \(X\sim\mathcal{N}(\mu,\sigma^2)\). To explain this, we need to look at transformations of random variables, introduced next.

📖 Textbook references

If you want more help with this section, check out:

6.11 Functions of random variables

Suppose \(X\colon\Omega\to X(\Omega)\) is a random variable, and \(g\colon X(\Omega)\to\mathcal{S}\) is some function. Then \(g(X)\) is also a random variable, namely the outcome to a ‘new experiment’ obtained by running the ‘old experiment’ to produce a value \(x\) for \(X\), and then evaluating \(g(x)\). Formally, as a function of \(\omega \in \Omega\), \(g(X):= g\circ X\), i.e., \[g(X)(\omega):= g(X(\omega))\text{ for all }\omega\in\Omega.\] For example, \[\pr{g(X)\in B}=\pr{ \{\omega\in\Omega\colon g(X(\omega))\in B\} } \text{ for all }B\subseteq\mathcal{S}.\]

Examples
  1. For any random variable \(X\), we can consider \(\sin(X)\), \(e^{3X}\), \(X^3\), and so on, which are all again random variables.

  2. Let \(X\) be the score when you roll a fair die and let \(Y = (X-3)^2\). Then \(Y\) is a discrete random variable with probability mass function

\(y\) \(0\) \(1\) \(4\) \(9\)
\(p(y)\) \(1/6\) \(1/3\) \(1/3\) \(1/6\)

and zero elsewhere. To see this, note that \(\{Y = 4\}=\{X \in \{1, 5\}\}\), and so on.

  1. If \(X\) is \(\mathrm{Bin}(n,p)\), then \(n-X\) is \(\mathrm{Bin}(n,1-p)\), as shown in Exercise 6.6.

  2. Let \(X\sim\mathrm{U}(0,1)\). For any constants \(a\) and \(b > 0\), define \(Y:= a + bX\). Then \(Y\sim\mathrm{U}(a,a+b)\), because for any \(x \in [0,1]\), \[\{ Y \leq a + bx \} = \{ a + bX \leq a + bx \} = \{ X \leq x \}\] so that \(\pr{Y \leq a + bx} = \pr{X \leq x} = x\), and consequently \(F(y)=\pr{Y\le y}=\frac{y-a}{b}\) whenever \(y\in[a,a+b]\). Therefore, by Equation 6.3, indeed, \(f(y)=1/b\) for \(y\in[a,a+b]\) (and zero elsewhere), so \(Y\) is uniformly distributed on \([a,a+b]\) by the definition of the Uniform distribution.

A similar result holds when \(b < 0\).

Example
If \(U\sim\mathrm{U}(0, 1)\) and \(X\) is a continuous random variable with a cumulative distribution function \(F_X\) which is strictly increasing on \([a, b]\), with \(F+X(a) = 0\) and \(F_X(b) = 1\), then \(F_X^{-1}\) exists and \(F_X^{-1}(U)\) has the same distribution as \(X\) because for any \(x\in [a,b]\), \[\pr{F_X^{-1}(U) \leq x} = \pr{U \leq F_X(x)} = F_X(x) = \pr{X \leq x}.\] This is a special case of the probability integral transform and is very useful for generating random samples of \(X\) with computer generated ‘uniform random numbers’. For example, \(-\frac{1}{\beta} \log (1 - U)\) is \(\mathcal{E}(\beta)\) and so is \(\frac{1}{\beta} \log 1/U\) (as \(U\) and \(1-U\) are both \(\mathrm{U}(0, 1)\)).

There is one particularly important function which enables us to get the cumulative distribution function of any normally distributed random variable, using just the the standard normal tables (i.e. \(\Phi\), the cumulative distribution function of the standard normal).

🔑 Key idea: Theorem: standardizing the normal distribution
Suppose \(\mu \in \mathbb{R}\) and \(\sigma>0\). If \(X \sim \mathcal{N}(\mu,\sigma^2)\) and \(Z \sim \mathcal{N}(0, 1)\), then \[\frac{X-\mu}{\sigma}\sim\mathcal{N}(0,1), \quad\text{ and }\quad \sigma Z + \mu\sim\mathcal{N}(\mu, \sigma^2).\]

Proof
We can prove this via a change of variable in the integral for the cumulative distribution function: see Exercise 6.15. A shorter proof goes via the moment generating function, which will be introduced later.

Corollary
If \(X\sim\mathcal{N}(\mu,\sigma^2)\) then \[F(x)=\Phi\left(\dfrac{x-\mu}{\sigma}\right).\]

💪 Try it out
Suppose \(X\sim\mathcal{N}(2,4)\). Find \(\pr{X \geq 5.28}\).

Answer:

We compute \[\begin{aligned} \pr{ X \geq 5.28 } & = \pr{ \frac{X-2}{2} \geq \frac{5.28-2}{2} } \\ & = \pr { Z \geq 1.64} ,\end{aligned}\] where \(Z\sim\mathcal{N}(0,1)\). Hence \[\pr{X \geq 5.28} = 1-\Phi (1.64) = 1-0.95 = 0.05 . \]

📖 Textbook references

For more help with this section, check out:

6.12 Historical context

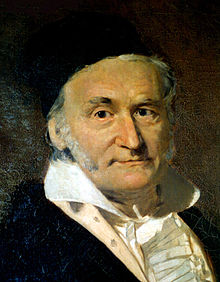
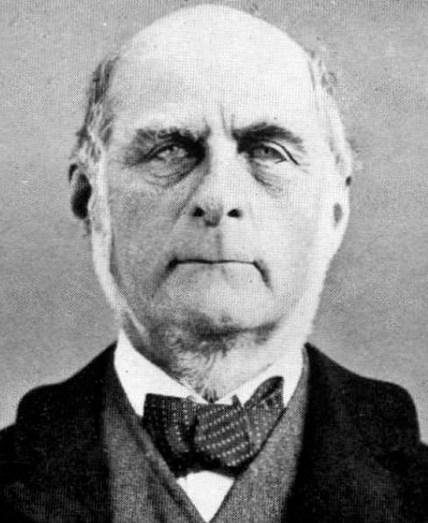
The normal distribution appeared already in work of de Moivre, and is sometimes known as the Gaussian distribution after Carl Friedrich Gauss (1777–1855). The name ‘normal distribution’ was applied by eugenicist and biometrician Sir Francis Galton (1822–1911) and statistician Karl Pearson (1857–1936) to mark the distribution’s ubiquity in biometric data.

de Moivre

Gauss

Galton

Pearson
Figure 6.1: (left to right) de Moivre, Gauss, Galton, and Pearson.

There is a great deal of subtle and interesting mathematics on the subject of what functions are integrable over what sets. You may see some of this in the third year probability course. The Riemann integral that we use here is sufficient for integrating piecewise continuous functions over finite unions of intervals. Here, we will only consider continuous random variables which have a piecewise continuous probability density function. Other approaches to integration are required to deal with more general functions.

For instance, for infinite countable unions of intervals, we would need the Lebesgue integral (see for instance (Rosenthal 2007)). More precisely, \(f(\cdot)\) still determines the value of \(\pr{X\in B}\) when \(B\) is an infinite countable union of intervals, but that value is not necessarily given by the Riemann integral.

The treatment of discrete and continuous random variables separately is a little irksome. A general treatment of random variables, which covers both cases, as well as cases that are neither discrete nor continuous, in a unified setting, requires the mathematical framework of measure theory; you will see some of this if you take later probability courses.


  1. In the programming language R, \(\phi\) is the function dnorm, and \(\Phi\) is the function pnorm.↩︎